|
Download Data (XLS File) |
|
||||||||
|
||||||||
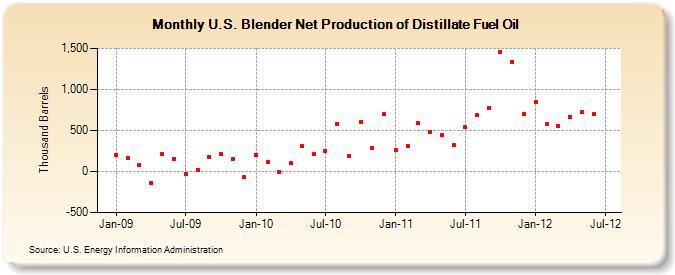
| U.S. Blender Net Production of Distillate Fuel Oil (Thousand Barrels) | ||||||||
| Year | Jan | Feb | Mar | Apr | May | Jun | Jul | Aug | Sep | Oct | Nov | Dec |
|---|---|---|---|---|---|---|---|---|---|---|---|---|
| 2009 | 196 | 160 | 76 | -136 | 212 | 155 | -35 | 20 | 176 | 208 | 154 | -70 |
| 2010 | 205 | 117 | 0 | 101 | 312 | 208 | 256 | 581 | 186 | 605 | 285 | 697 |
| 2011 | 263 | 316 | 585 | 486 | 445 | 323 | 539 | 685 | 773 | 1,459 | 1,338 | 702 |
| 2012 | 842 | 575 | 552 | 666 | 731 | 701 | ||||||
| - = No Data Reported; -- = Not Applicable; NA = Not Available; W = Withheld to avoid disclosure of individual company data. |
| Release Date: 8/30/2012 |
| Next Release Date: Last Week of September 2012 |
Referring Pages: