Short-Term Energy and Winter Fuels Outlook
Release Date: October 10, 2012 | Next Release Date: November 6, 2012 | Full Report | Text Only | All Tables | All Figures
Natural Gas
U.S. Natural Gas Consumption
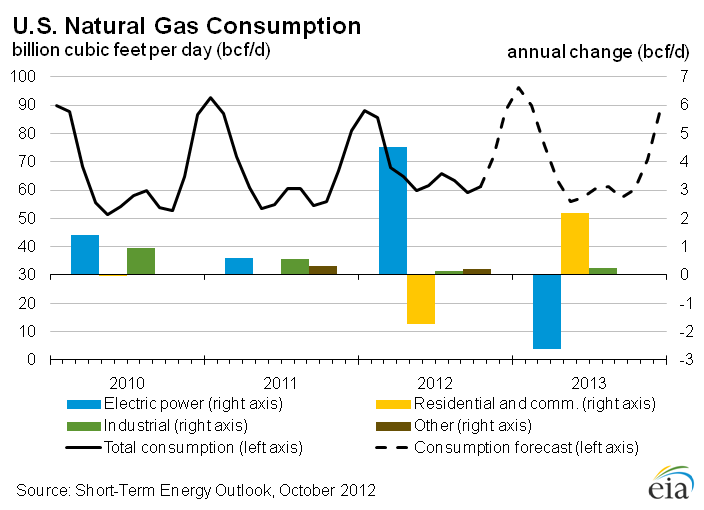
EIA expects that natural gas consumption will average 69.8 billion cubic feet per day (Bcf/d) in 2012, an increase of 3.1 Bcf/d (4.7 percent) from 2011. Large gains in electric power use in 2012 more than offset declines in residential and commercial use. Projected consumption of natural gas in the electric power sector averages 25.4 Bcf/d in 2012, 22 percent higher than in 2011, primarily driven by the improved relative cost advantages of natural gas over coal for power generation in some regions. Consumption in the electric power sector during 2012 was 35.1 Bcf/d in July 2012, when electricity demand for air conditioning was highest.
Projected total natural gas consumption decreases by 0.2 Bcf/d (0.2 percent) in 2013. Expected declines in the electric power sector offset increases in residential, commercial, and industrial consumption. A forecast of near-normal weather during the upcoming winter (i.e., colder than last year's abnormally warm winter) drives 2013 increases in residential and commercial consumption of 11.5 percent and 10.3 percent, respectively. Although projected higher natural gas prices contribute to a 10.4-percent decline in forecast natural gas consumption in the electric power sector in 2013, consumption in the power sector next year is still expected to be about 1.9 Bcf/d higher than 2011 levels and high by historical standards.
U.S. Natural Gas Production and Imports
Total marketed production of natural gas grew by 4.8 Bcf/d (7.9 percent) in 2011. This strong growth was driven in large part by increases in shale gas production. So far during 2012, production has fluctuated with small ups and downs, in contrast to the strong upward growth seen between 2009 and 2011. EIA expects some small declines in production in the coming months, related to recent drops in the rig count. According to Baker Hughes, the natural gas rig count was 437 as of October 4, 2012, compared with 811 at the start of 2012. EIA forecasts that total marketed production growth will slow to 2.6 Bcf/d in 2012 and 0.4 Bcf/d in 2013, as the reduction in drilling activity is offset by growth in production from liquids-rich natural gas production areas such as the Eagle Ford and wet areas of the Marcellus Shale, and associated gas from the growth in domestic crude oil production.
EIA expects pipeline gross imports will fall by 0.2 Bcf/d (2.3 percent) in 2012, as domestic supply continues to displace Canadian sources. The warm winter in the United States early this year also added to the year-over-year decline in imports, particularly to the Northeast where imported natural gas can serve as additional supply in times of very cold weather. EIA expects little change in pipeline gross imports in 2013. Pipeline gross exports grew by 1.0 Bcf/d (33 percent) in 2011, driven by increased exports to Mexico, but are expected to remain mostly flat in 2012, and grow by 0.1 Bcf/d in 2013.
Liquefied natural gas (LNG) imports are expected to fall by about one-half in 2012 from the year before. EIA expects that an average of about 0.5 Bcf/d will arrive in the United States (mainly at the Elba Island terminal in Georgia and the Everett terminal in New England) both in 2012 and 2013, either to fulfill long-term contract obligations or to take advantage of temporarily high local prices due to cold snaps and disruptions. Higher prices for LNG, particularly in Asian markets, have made the United States a market of last resort for LNG suppliers.

U.S. Natural Gas Inventories
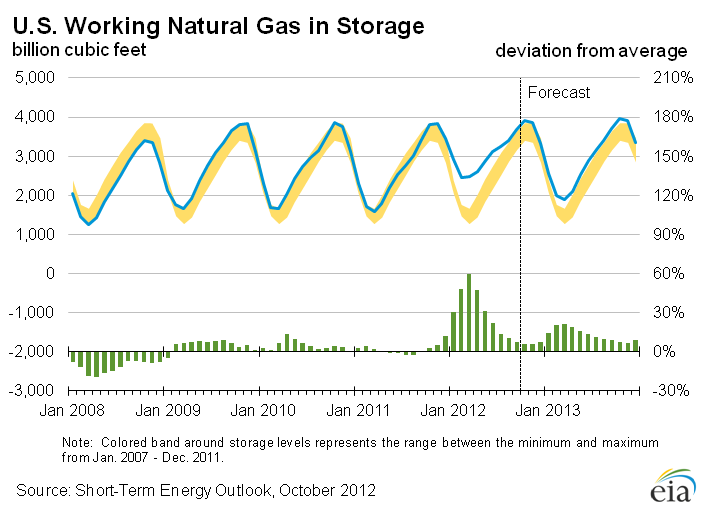
Working natural gas inventories remain at historically high levels for this time of year. As of September 28, 2012, according to EIA's Weekly Natural Gas Storage Report, working inventories totaled 3,653 Bcf, which is 272 Bcf greater than last year's level and 281 Bcf above the five-year average. EIA expects that inventory levels at the end of October 2012 will set a record high of 3,903 Bcf. Because of very high inventories at the start of the summer injection season this year, working inventories have remained high and stock builds have been below both the five-year average and last year's level since April 2012, with a few exceptions. The projected increase of 1,426 Bcf in working gas inventory during the 2012 injection season (from the beginning of April through the end of October) would be the smallest build since 1987.
U.S. Natural Gas Prices
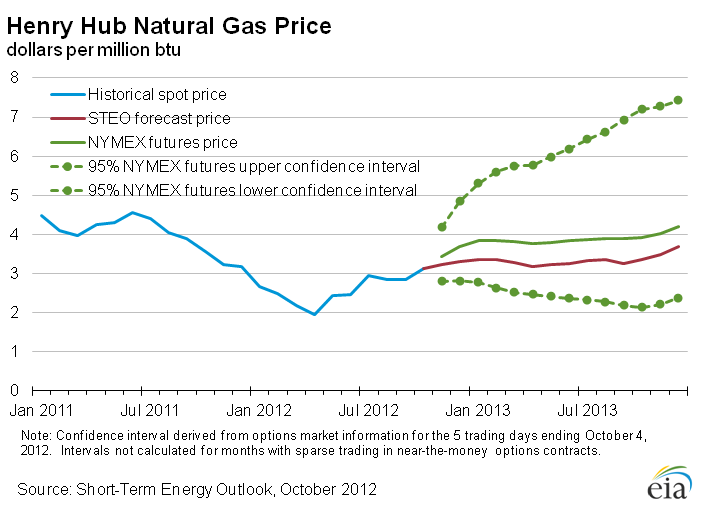
Natural gas spot prices averaged $2.85 per MMBtu at the Henry Hub in September 2012, up $0.01 per MMBtu from the August average and $1.05 per MMBtu (27 percent) lower than the September 2011 average. While abundant supplies have kept prices relatively low, a hot summer and associated increases in demand for natural gas for power generation contributed to Henry Hub spot price increases this summer, from the monthly average low of $1.95 per MMBtu in April 2012. EIA expects the Henry Hub natural gas price will average $2.71 per MMBtu in 2012 and $3.35 per MMBtu in 2013.
Natural gas futures prices for January 2013 delivery (for the five-day period ending October 4, 2012) averaged $3.84 per MMBtu. Current options and futures prices imply that market participants place the lower and upper bounds for the 95-percent confidence interval for January 2013 contracts at $2.77 per MMBtu and $5.31 per MMBtu, respectively. At this time last year, the January 2012 natural gas futures contract averaged $4.10 per MMBtu and the corresponding lower and upper limits of the 95-percent confidence interval were $3.10 per MMBtu and $5.40 per MMBtu.

| U.S. Natural Gas Summary | ||||
|---|---|---|---|---|
| 2010 | 2011 | 2012 projected | 2013 projected | |
| Prices | (dollars per thousand cubic feet) | |||
| Wellhead | 4.48 | 3.90 | 2.66 | 3.27 |
| Henry Hub Spot | 4.52 | 4.12 | 2.79 | 3.45 |
| Residential Sector | 11.37 | 11.01 | 10.87 | 11.09 |
| Commercial Sector | 9.41 | 8.92 | 8.39 | 8.98 |
| Industrial Sector | 5.49 | 5.11 | 3.94 | 4.59 |
| Supply | (billion cubic feet per day) | |||
| Marketed Production | 61.38 | 66.22 | 68.85 | 69.22 |
| Dry Gas Production | 58.44 | 63.01 | 65.36 | 65.72 |
| Pipeline Imports | 9.07 | 8.51 | 8.31 | 8.42 |
| LNG Imports | 1.18 | 0.96 | 0.46 | 0.45 |
| Consumption | (billion cubic feet per day) | |||
| Residential Sector | 13.12 | 12.96 | 11.82 | 13.18 |
| Commercial Sector | 8.50 | 8.67 | 8.07 | 8.91 |
| Industrial Sector | 17.86 | 18.41 | 18.55 | 18.79 |
| Electric Power Sector | 20.24 | 20.83 | 25.36 | 22.73 |
| Total Consumption | 65.14 | 66.62 | 69.76 | 69.60 |
| Primary Assumptions | (percent change from previous year) | |||
| Heating Degree-days | -0.6 | -3.4 | -10.2 | 14.2 |
| Cooling Degree-days | 17.2 | 2.0 | -0.7 | -13.0 |
| Commercial Employment | -0.1 | 1.8 | 1.9 | 1.8 |
| Natural-gas-weighted Industrial Production | 7.6 | 1.6 | 0.9 | 0.6 |
Interactive Data Viewers
Provides custom data views of historical and forecast data
STEO Custom Table Builder ›
Real Prices Viewer ›
| Related Tables | |||||||
|---|---|---|---|---|---|---|---|
| Table WF01. Average Consumer Prices and Expenditures for Heating Fuels During the Winter | |||||||
| Table 1. U.S. Energy Markets Summary | |||||||
| Table 2. U.S. Energy Prices | |||||||
| Table 5a. U.S. Natural Gas Supply, Consumption, and Inventories | |||||||
| Table 5b. U.S. Regional Natural Gas Prices | |||||||
| Table 8. U.S. Renewable Energy Consumption | |||||||
| Table 9a. U.S. Macroeconomic Indicators and CO2 Emissions | |||||||
| Table 9b. U.S. Regional Macroeconomic Data | |||||||
| Table 9c. U.S. Regional Weather Data | |||||||
| Related Articles | ||
|---|---|---|
| Today In Energy | Daily | |
| Natural Gas Weekly Update | Weekly | |
| Peak Underground Working Storage Capacity | Annual | |
| Change in STEO Regional and U.S. Degree Day Calculations | Sep-2012 | |
| 2012 Outlook for Hurricane-Related Production Outages in the Gulf of Mexico | Jun-2012 | |
| 2011-2012 Winter Fuels Outlook Slideshow | Oct-2011 | |
| Changes in Natural Gas Monthly Consumption Data Collection and the Short-Term Energy Outlook | Dec-2010 | |
| Trends in U.S. Residential Natural Gas Consumption | 23-Jun-2010 | |
| Probabilities of Possible Future Prices | Apr-2010 | |
| Energy Price Volatility and Forecast Uncertainty | Oct-2009 | |
| The Implications of Lower Natural Gas Prices for Electric Generators in the Southeast | May-2009 |