
Focus on Prices and Spending | Producer Price Indexes | Volume 1, Number 7
On this page
Current Price Topics: PPI Industry or Commodity Data: Which Better Suits Your Needs?
"Why does BLS publish Producer Price Index (PPI) data using both industry and commodity classifications?[1] What are the differences between the two and which is more appropriate to meet my needs?" These are common questions asked by users of PPI data. This quarter's Focus on Prices and Spending: Producer Price Index examines the differences between the two systems and offers some guidance regarding when one would be preferable over the other. On a theoretical basis, industry indexes measure price changes based on the industry that produces the product or provides the service, whereas commodity indexes measure price changes based solely on the commodity or service itself, regardless of the type of company producing or providing it. In practical terms, though, there are additional subtle differences that may lead users to prefer one set of data over the other.
Although PPIs are organized into two very different classification systems, both structures draw from the same pool of price information provided to BLS by survey respondents. The price quotations that form the basis of the PPI dataset are sampled, collected, and updated based on their industry of origin, with industries defined according to the North American Industry Classification System (NAICS).[2] Industry-based PPIs exist for specific products of industries, industries in their entirety, as well as for groupings of industries, and date to the early to mid-1980s. Within each covered industry, PPI calculates aggregate indexes for both primary products and secondary products. Primary products are those that are principally, though not always exclusively, made by an industry—typically those products that are a company's main line of business. For example, pharmaceutical preparations are the primary products of the pharmaceuticals manufacturing industry (NAICS 325412). Secondary products indexes incorporate prices for items that are primary to some other industry; for example, management consulting services (NAICS 54161) provided by companies classified in the certified public accounting industry (NAICS 541211).
The commodity-based classification structure produced by PPI is unique to BLS, and there are continuous data in some specific categories dating back to 1913. Many improvements to commodity indexes have been implemented over time; the original calculations were an unweighted average for only about 250 commodities. However, the underlying notion that all products can be organized under a commodity-based structure employing progressive levels of detail remains to this day. The current PPI commodity-based publication structure includes more than 4,000 indexes and employs gross value-of-shipments weights.[3]
The commodity-based classification system organizes products by material composition and level of fabrication for goods and by similarity of service for services producers, allowing users to track changes in selling prices for products irrespective of industry of origin. At the most detailed level of publication, which PPI refers to as cell level indexes, similarly titled industry and commodity indexes may or may not exhibit similar price movements. If a particular commodity is produced nearly exclusively by one industry, then the comparably titled industry and commodity indexes will display very similar index movements. The industry and commodity indexes for cigarettes provide a good example, because essentially all domestically produced cigarettes are made by manufacturers classified under NAICS 312221, cigarette manufacturing. In contrast, for some products or services, more than one industry maintains substantial production, and as a result, cell level commodity indexes can move quite differently than similarly titled industry counterparts. For example, there exists sizable production of cold finished steel bars by both the iron and steel mill and the rolled steel shape manufacturing industries. As a result, the commodity index for cold finished steel bars, which combines price quotations from both industries into a single commodity index, provides a more complete picture of cold finished steel bars' price movements.
Users searching for indexes that measure changes in prices received by industries or groupings of industries, and users looking for price movement data that correspond with other data organized by industry (such as revenue figures or industrial production statistics), will find PPI data organized by NAICS particularly useful. In contrast, users wishing to track changes in prices for specific products, services, or groupings of products or services irrespective of industry of origin and users interested in historical data prior to 1980 will find that commodity-based PPIs are a more relevant measure of inflation. In addition, the Internal Revenue Service recommends the use of PPI commodity data for last in–first out (LIFO) inventory valuation purposes when filing business tax returns.[4] Because commodity indexes are organized by material composition and level of fabrication for goods and similarity of service for services producers, they are capable of providing a more complete picture of price movement through expanded coverage of producers across multiple industries.
The decision to use one classification system rather than the other also is influenced by index availability. Due to the underlying differences between the industry and commodity classification systems, many aggregate indexes exist under only one of the structures. From an industry standpoint, sector level indexes such as the PPIs for the net output of total mining, total manufacturing, and selected health care industries provide meaningful data for groupings not available by commodity.[5] Similarly, certain commodity index aggregations, such as the commodity indexes for industrial chemicals, lumber, and transportation of freight and mail cannot exist under the more rigidly defined, industry-based classification schema.
Current Price Trends: Second Quarter 2010 Led by Falling Prices for Crude Goods; PPIs Reverse Course
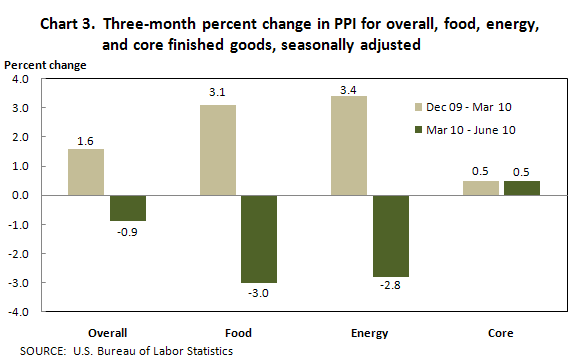
Prices received by producers of crude goods fell 6.2 percent in the second quarter of 2010, after climbing 8.2 percent in the first quarter of 2010. Leading this reversal, the index for crude energy goods dropped 9.2 percent following a 9.0-percent rise in the first quarter of 2010. Also contributing to the crude goods downturn—though to a lesser degree—prices for both crude foodstuffs and feedstuffs and for crude nonfood materials less energy fell in the second quarter after advancing in first quarter. (See chart 1.) The intermediate goods index, which tracks price changes for processed goods for business demand, rose less in the second quarter than in the previous quarter. The index for intermediate energy goods turned down, while price increases slowed for intermediate goods other than foods and energy. (See chart 2.) The finished goods index fell after rising in the first quarter of 2010 due to downturns in prices for finished energy goods and consumer foods.[6] (See chart 3.)


Economic background
Reflecting signs of uncertainty in the economy, PPIs for finished, intermediate, and crude goods shifted course by mid 2010—some PPIs turned down while others advanced at much slower rates—following steep run-ups that began in early-to-mid 2009. Prices for unprocessed commodities tend to be sensitive to even subtle shifts in the economy, often resulting in quick adjustments in prices for crude goods. More highly processed intermediate and finished goods commonly exhibit price movements that are somewhat different from price movements for less processed goods, because basic material costs tend to be a smaller portion of total costs for producers of more highly processed goods than for manufacturers of less processed goods. Contracts and escalation agreements also can delay or mitigate the pass-through effect of early-stage price volatility at successive stages of processing.[7]
Displaying a shift similar to those in PPIs, gross domestic product (GDP) in 2009 showed consistent improvement, but by the first quarter of 2010, GDP growth slipped to 3.7 percent, compared with 5.0 percent in the fourth quarter of 2009. This deceleration mainly was due to weak residential and nonresidential fixed investment in structures (that is, in construction).[8] In the second quarter GDP figures continued their slide, with the growth rate slipping to 2.4 percent.
Events in recent months point to the potential for continued economic uncertainty. The U.S. housing market continues to sputter as evidenced by the June 23 new home sales report that stated sales of new single-family houses fell 32.7 percent from April to May 2010, and 18.3 percent compared with their May 2009 level.[9] In addition, the financial crisis in Greece contributed to a drop in the value of the European currency relative to the U.S. dollar[10] and fueled speculation in the United States of a worsening trade balance. In contrast, corporate profits and industrial production have improved, suggesting that the weak construction and foreign trade sectors remain the main hindrance to a more robust economic recovery. Total industrial production climbed 7.6 percent from May 2009 to May 2010, with gains observed in most market groups,[11] and corporate profits in the first quarter of 2010 were, on average, 34.0 percent higher than their year-ago levels.[12]
Crude goods
The Producer Price Index for Crude Materials for Further Processing declined 6.2 percent in the 3-month period ending in June 2010 subsequent to an 8.2-percent advance in the 3-month period ending in March. Accounting for about half of the broad-based second quarter downturn, prices for crude energy materials fell 9.2 percent after climbing 9.0 percent in the previous quarter. The indexes for crude foodstuffs and feedstuffs and for crude nonfood materials less energy fell 5.0 and 2.6 percent, respectively, subsequent to posting gains in the 3-month period ending in March.
The index for crude energy materials fell 9.2 percent from March to June, compared with a 9.0-percent gain for the 3-month period ending in March. Prices for crude petroleum decreased 8.0 percent following a 15.4-percent rise in the preceding quarter. The index for natural gas also turned down, declining 15.0 percent after rising 7.1 percent in the first quarter of 2010. In contrast, prices for coal moved up 3.8 percent in the 3-month period ending in June, following a 4.4-percent decline in the first quarter of 2010.
The index for crude foodstuffs and feedstuffs declined 5.0 percent from March to June, following a 5.0-percent advance in the previous quarter. Prices for slaughter cattle fell 0.5 percent in the second quarter of 2010 subsequent to a 15.7-percent jump from December to March. The indexes for fresh and dry vegetables, slaughter hogs, milk (for fluid use), ungraded chicken eggs, and for both unprocessed finfish and shellfish also decreased from March to June subsequent to advancing in the first quarter of 2010. In contrast, the decrease in the index for corn slowed to 8.0 percent in the 3-month period ending in June after falling 16.3 percent in the previous 3-month period. Prices for soybeans turned up after declining in the first quarter of 2010.
The index for crude nonfood materials less energy turned down 2.6 percent in the 3-month period ending in June following an 11.8-percent gain in the previous 3-month period. The index for iron and steel scrap fell 3.5 percent following a 35.1-percent hike in the first quarter of 2010. From March to June, prices for both corrugated and mixed wastepaper, nonferrous scrap, and pulpwood also decreased after advancing in the previous 3-month period. Prices for hides and skins rose less than in the December-to-March period. In contrast, the index for construction sand and gravel turned up 1.3 percent in the second quarter after falling 1.1 percent in the preceding 3 months. Prices for corn fell less than in the first quarter.
Intermediate goods
The Producer Price Index for Intermediate Materials, Supplies, and Components increased 0.3 percent in the 3-month period ending in June 2010 subsequent to a 2.4-percent advance in the 3-month period ending in March. Price increases for intermediate materials less foods and energy slowed to 0.9 percent from March to June from 2.1 percent from December to March. The index for intermediate energy goods decreased 2.1 percent during the second quarter of 2010, after climbing 4.9 percent in the previous quarter. In contrast, prices for intermediate foods and feeds increased 1.1 percent in the 3-month period ending in June following a 1.4-percent decline in the previous 3-month period.
The index for intermediate energy goods declined 2.1 percent from March to June after rising 4.9 percent from December to March. Prices for gasoline moved down 10.9 percent subsequent to a 5.2-percent gain in the first quarter of 2010. The indexes for diesel fuel, jet fuel, liquefied petroleum gas, lubricating oil materials, natural gas to electric utilities, and heating oil also turned down in the second quarter of 2010. In contrast, prices for industrial electric power advanced 1.6 percent in the 3-month period ending in June, compared with a decline of 1.2 percent in the previous 3-month period.
The index for intermediate goods less foods and energy advanced 0.9 percent in the 3-month period ending in June following a 2.1-percent gain in the prior 3-month period. From March to June, higher prices for both hot and cold rolled steel sheet and strip, thermoplastic resins and materials, paper boxes and containers, building paper and building board mill products, and woodpulp outweighed lower prices for basic organic chemicals and for copper and brass mill shapes.
The index for intermediate foods and feeds increased 1.1 percent in the second quarter of 2010 following a 1.4-percent decline in the first quarter. Prices for beef and veal rose 14.8 percent from March to June subsequent to an increase of 6.9 percent from December to March. The indexes for formula feeds; corn, cottonseed, and soybean cake and meal; and confectionery materials decreased at slower rates compared with the first quarter. Prices for natural cheese (except cottage cheese) turned up from March to June. In contrast, the index for pork moved up 2.6 percent in the 3-month period ending in June after climbing 10.4 percent in the preceding 3-month period. Prices for portion control meats also rose less in the second quarter and the index for processed eggs turned down after rising in the first quarter.
Finished goods
The Producer Price Index for Finished Goods declined 0.9 percent from March to June after rising 1.6 percent in the previous 3-month period. Prices for finished energy goods led this downturn, falling 2.8 percent subsequent to climbing 3.4 percent from December to March. The index for finished consumer foods also turned down, dropping 3.0 percent in the 3 months ending in June following a 3.1-percent increase in the prior 3 months. Prices for finished goods other than foods and energy moved up 0.5 percent in both quarters of the first half of 2010.
The index for finished energy goods moved down 2.8 percent in the 3 months ending in June compared with a 3.4-percent advance from December to March. Prices for liquefied petroleum gas fell 11.5 percent in the second quarter following a 7.1-percent advance in the prior 3-month period. The indexes for gasoline, home heating oil, residential natural gas, diesel fuel, and kerosene also turned down after rising in the 3 months ending in March. In contrast, prices for residential electric power increased 2.2 percent from March to June after no change in the previous 3-month period.
The index for finished consumer foods decreased 3.0 percent in the second quarter of 2010 following a 3.1-percent increase in the first quarter. Leading this downturn, prices for fresh vegetables (except potatoes) dropped 48.9 percent from March to June, more than reversing a 47.5-percent advance in the 3-month period ended March 2010. The indexes for eggs for fresh use, soft drinks, finfish and shellfish, and processed poultry also turned down after moving up in the 3 previous months. Prices for pork advanced less in the 3 months ending in June than in the prior quarter. Conversely, the rise in the index for beef and veal accelerated to 14.8 percent in the second quarter from 6.9 percent in the first quarter of 2010. Prices for natural cheese (except cottage cheese) and hot breakfast cereals turned up from March to June after falling in the 3-month period ending in March.
The index for finished goods less foods and energy moved up 0.5 percent for the second consecutive quarter. In the 3-month period ending in June, rising prices for cigarettes, pharmaceutical preparations, civilian aircraft, converted paper and paperboard products, tires, and heavy motor trucks more than offset declines in the indexes for light motor trucks, computers and related equipment, and communication and related equipment.
Trade industries
The Producer Price Index for the Net Output of Total Trade Industries declined 2.3 percent in the second quarter of 2010 after rising at the same rate in the first quarter. (Trade industry PPIs measure changes in margins received by wholesalers and retailers.) Leading this downturn, margins received by durable goods wholesalers fell 8.5 percent in the second quarter following a 5.0-percent increase in the prior quarter. Margins received by family clothing stores, general merchandise stores, and supermarkets also decreased following advances in the first quarter of 2010. The margin index for nondurable goods wholesalers inched up 0.1 percent in the second quarter after climbing 5.9 percent in the preceding quarter. In contrast, margins received by gasoline stations moved up 3.4 percent following a 21.7-percent drop in the first quarter. The margin indexes for discount department stores and home improvement centers also turned up in the second quarter.
Transportation and warehousing industries
The Producer Price Index for the Net Output of Transportation and Warehousing Industries increased 1.6 percent in the second quarter of 2010 following a similar rise of 1.7 percent in the first quarter. During the second quarter, higher prices received by the industries for long distance general freight trucking, scheduled air transportation, line-haul railroads, couriers, deep sea freight transportation, general warehousing and storage, and inland water freight transportation outweighed lower prices received by the industry for coastal and Great Lakes freight transportation.
Traditional service industries
The Producer Price Index for the Net Output of Total Traditional Service Industries advanced 1.0 percent in the second quarter of 2010 after edging up 0.1 percent in the first quarter. Leading this acceleration, prices received by the depository credit intermediation industry group climbed 6.5 percent in the second quarter following a 4.3-percent drop in the previous quarter. The indexes for non-casino hotels and motels and for wired telecommunications carriers also turned up after falling in the first quarter. Prices received by the investment banking and securities dealing industry rose more in the second quarter than they had in the first. In contrast, prices received by direct health and medical insurance carriers advanced 0.4 percent in the second quarter after rising 2.6 percent in the prior quarter. The industry index for offices of lawyers also moved up less than it had in the first quarter. Prices received by general medical and surgical hospitals and by portfolio managers inched down after increasing in the prior quarter.
Further information is available from the PPI Section of Index Analysis and Public Information, at ppi-info@bls.gov or (202) 691-7705.
Notes
[1] PPI industry data are found in Table 5 and commodity data are found in Table 6 of the PPI Detailed Report.
[2] The North American Industry Classification System (NAICS) is administered by the U.S. Census Bureau. For more information about NAICS, visit http://www.census.gov/eos/www/naics/index.html.
[3] A handful of commodity-based PPIs for physical products provide data back to 1910s and 1920s, with 30- to 40-year histories common for most others. Commodity-based, where-ever-provided services indexes were introduced into the PPI in 2009.
[4] See IRS form 970 at http://www.irs.gov/pub/irs-pdf/f970.pdf.
[5] PPIs organized by industry include a concept called net output weighting, whereas PPIs organized by commodity grouping are sometimes hampered by their use of gross weights. In short, gross weights can lead to multiple counting of price change at successive levels of aggregation, although net output weighting corrects for this flaw. For more information on this topic, see pages 7 to 9 at http://www.bls.gov/opub/hom/pdf/homch14.pdf, the PPI methodology chapter from the BLS Handbook of Methods.
[6] Price movements for PPIs described in this text include preliminary data for the months of April 2010 through June 2010. All PPI data are recalculated 4 months after original publication to reflect late data received by survey respondents. Seasonally adjusted PPIs are recalculated, on an annual basis, for 5 years, to reflect more recent seasonal patterns.
[7] For a detailed discussion of price transmission across stages of processing, see Jonathan Weinhagen, "An empirical analysis of price transmission by stage of processing," Monthly Labor Review, November 2002, pp. 3–11, as well as Jonathan Weinhagen, "Consumer gasoline prices: an empirical investigation," Monthly Labor Review, July 2003, pp. 3–10.
[8] Gross Domestic Product: Second Quarter 2010 (Advance Estimate), BEA 10–37 (Bureau of Economic Analysis, July 30, 2010), at (http://www.bea.gov/newsreleases/national/gdp/2010/pdf/gdp2q10_adv.pdf), page 11.
[9] New Residential Sales in May 2010, CB10-92 (U.S. Department of Commerce, June 23, 2010), at (http://www.census.gov/const/newressales_201005.pdf).
[10] See Reuters.com at (http://www.reuters.com/finance/currencies/quote?srcAmt=1&srcCurr=EUR&destAmt=&destCurr=USD) for a chart of euro to U.S. dollar exchange rates.
[11] Industrial Production and Capacity Utilization, G.17 (419) (Board of Governors of the Federal Reserve System, June 16, 2010), Table 1 (page 8), at (http://www.federalreserve.gov/releases/g17/20100616/).
[12] Gross Domestic Product: First Quarter 2010 (Third Estimate), BEA 10–31 (Bureau of Economic Analysis, June 25, 2010), at (http://www.bea.gov/newsreleases/national/gdp/2010/pdf/gdp1q10_3rd.pdf), page 13.