Short-Term Energy and Winter Fuels Outlook
Release Date: October 10, 2012 | Next Release Date: November 6, 2012 | Full Report | Text Only | All Tables | All Figures
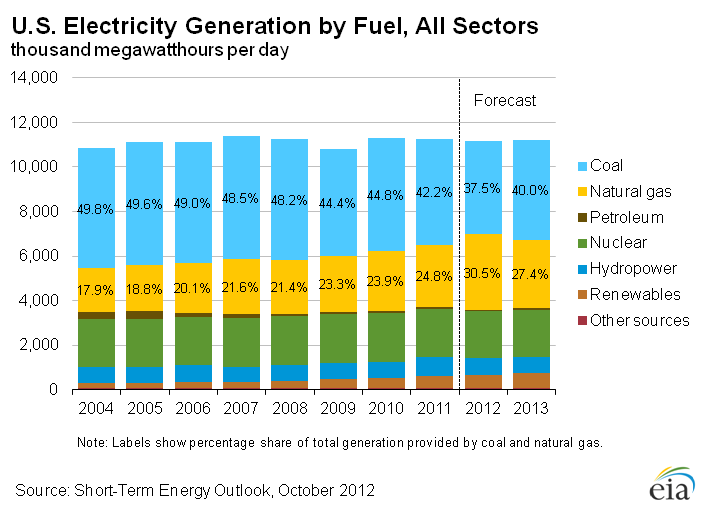
Coal
U.S. Coal Supply
EIA forecasts that coal production will decline by 6 percent in 2012 as domestic consumption falls. EIA expects that production will total 1,027 million short tons (MMst) in 2012, 68 MMst below the 2011 total. EIA expects production to fall by 1 percent (12 MMst) in 2013 as inventory draws and lower exports offset an increase in domestic consumption in the forecast. Electric power sector stocks, which ended 2011 at 175 MMst, are forecast to total 187 MMst at the end of the 2012. Inventories are expected to decline slightly in 2013, but they will remain at elevated levels.


U.S. Coal Trade
EIA expects U.S. coal exports to remain strong in 2012 and exceed the 107 MMst exported in 2011. The United States exported 11.6 MMst of coal in July, the fifth consecutive month with exports exceeding 11 MMst. EIA projects coal exports to total a record 125 MMst in 2012. EIA expects that coal exports will decline in 2013 but remain above 100 MMst for the third straight year. Falling international coal prices and slower economic growth, particularly in China, are primary reasons for the expected decline in coal exports. U.S. exports could be higher if there are significant supply disruptions from any of the major coal-exporting countries. U.S. coal exports averaged 56 MMst in the decade preceding 2011.
U.S. Coal Prices
Delivered coal prices to the electric power industry increased steadily over the 10-year period ending in 2011, when the delivered coal price averaged $2.40 per MMBtu (a 6-percent increase from 2010). However, EIA expects the decline in demand for coal, combined with large coal inventories, will begin to put downward pressure on coal prices and contribute to the shut-in of higher-cost production. EIA forecasts that the delivered coal price will average $2.40 per MMBtu in 2012 and $2.42 per MMBtu in 2013.
| U.S. Coal Summary | ||||
|---|---|---|---|---|
| 2010 | 2011 | 2012 projected | 2013 projected | |
| Prices | (dollars per million Btu) | |||
| Electric Power Sector | 2.27 | 2.40 | 2.40 | 2.42 |
| Supply | (million short tons) | |||
| U.S. Coal Production | 1084.4 | 1095.6 | 1027.2 | 1015.0 |
| Imports | 19.4 | 13.1 | 10.2 | 11.1 |
| Exports | 81.7 | 107.3 | 125.4 | 106.8 |
| Consumption | (million short tons) | |||
| Electric Power Sector | 975.1 | 928.6 | 826.7 | 865.9 |
| Other Sectors | 73.5 | 70.5 | 67.4 | 73.4 |
| Total Consumption | 1048.5 | 999.0 | 894.1 | 939.4 |
| End of Period Inventories | (million short tons) | |||
| Electric Power Sector | 174.9 | 175.1 | 186.9 | 182.0 |
| Total Inventories | 231.7 | 234.7 | 242.3 | 234.3 |
Interactive Data Viewers
Provides custom data views of historical and forecast data
STEO Custom Table Builder ›
Real Prices Viewer ›
| Related Articles | ||
|---|---|---|
| Today In Energy | Daily |