|
Download Data (XLS File) |
|
||||||||
|
||||||||
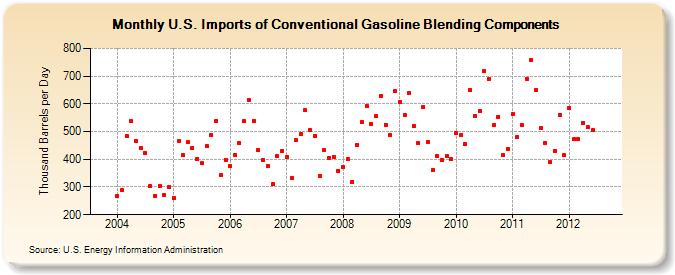
| U.S. Imports of Conventional Gasoline Blending Components (Thousand Barrels per Day) | ||||||||
| Year | Jan | Feb | Mar | Apr | May | Jun | Jul | Aug | Sep | Oct | Nov | Dec |
|---|---|---|---|---|---|---|---|---|---|---|---|---|
| 2004 | 267 | 288 | 483 | 537 | 466 | 442 | 422 | 304 | 267 | 302 | 272 | 301 |
| 2005 | 262 | 465 | 414 | 461 | 442 | 401 | 385 | 447 | 487 | 539 | 345 | 399 |
| 2006 | 376 | 417 | 457 | 537 | 614 | 539 | 433 | 398 | 377 | 309 | 411 | 429 |
| 2007 | 410 | 334 | 469 | 490 | 576 | 504 | 483 | 339 | 433 | 406 | 408 | 358 |
| 2008 | 372 | 400 | 319 | 453 | 536 | 592 | 529 | 555 | 629 | 525 | 488 | 645 |
| 2009 | 607 | 561 | 639 | 521 | 457 | 588 | 464 | 362 | 413 | 399 | 412 | 400 |
| 2010 | 495 | 488 | 454 | 650 | 556 | 573 | 719 | 688 | 523 | 554 | 416 | 438 |
| 2011 | 563 | 481 | 523 | 691 | 759 | 651 | 512 | 458 | 390 | 431 | 558 | 414 |
| 2012 | 585 | 473 | 473 | 530 | 515 | 504 | ||||||
| - = No Data Reported; -- = Not Applicable; NA = Not Available; W = Withheld to avoid disclosure of individual company data. |
| Release Date: 8/30/2012 |
| Next Release Date: Last Week of September 2012 |