
Focus on Prices and Spending | Consumer Prices | Volume 1, Number 6
On this page
Current Price Topics: The Use of the CPI in Adjusting Federal Income Tax Brackets and other Federal Tax Parameters
More than 140 million individual federal tax returns are filed each year.[1] Federal income tax brackets, as well as personal exemption amounts, standard deduction amounts, and other tax parameters, are adjusted each year by changes in the Consumer Price Index (CPI).
Before 1985, federal income tax brackets were not indexed to changes in the cost of living. As such, inflation eroded a family's purchasing power in multiple ways. First, families whose income did not keep up with inflation saw their real incomes fall. Second, even families whose pre-tax income kept pace with inflation were subject to reductions in real disposable income, as nominal increases in income forced taxpayers into higher tax brackets. For example, suppose a family's cost of living rose 5 percent in a year, as did its income. At first glance, the real income of this family has not changed, as its income has kept up with inflation. However, before 1985, the increase in the nominal income of this family would have resulted in higher federal income taxes, as more of the family's income would have been subject to the highest applicable tax bracket. This type of subtle tax increase is known as bracket creep. The Economic Recovery Tax Act (ERTA) of 1981 was passed, in part, to prevent bracket creep from adversely affecting American taxpayers.
Because of ERTA, and modifications made to that act in 1986, federal income tax brackets, as well as personal exemptions and standard deductions, are now tied to changes in the average CPI for All Urban Consumers (CPI-U) for the U.S. City Average for All items for the 12-month period ending in August of each year.
How the CPI-U affects federal income tax brackets
To see how the all items CPI-U affects federal income tax brackets, first take a look at the federal income tax brackets for 2008 for a married couple filing jointly. (See table 1.)
| Marginal tax rate (in percent) | Tax brackets |
|---|---|
10 |
Under $16,050 |
15 |
$16,051–$65,100 |
25 |
$65,101–$131,450 |
28 |
$131,451–$200,300 |
33 |
$200,301–$357,700 |
35 |
Over $357,700 |
To determine the 2009 federal income tax brackets, the Internal Revenue Service (IRS) looked at the average CPI-U from September 2007 through August 2008, and compared that average with the one for the preceding 12 months. For the 12 months ending in August 2007, the average CPI-U was 204.873. For the 12 months ending August 2008, the average CPI-U was 213.605, an increase of 4.26 percent. Therefore, each of the individual federal income tax brackets for 2009 was adjusted upwards by approximately 4.26 percent.[2] (See table 2.)
| Marginal tax rate (in percent) | Tax brackets |
|---|---|
10 |
Under $16,700 |
15 |
$16,701–$67,900 |
25 |
$67,901–$137,050 |
28 |
$137,051–$208,850 |
33 |
$208,851– $372,950 |
35 |
Over $372,950 |
CPI data were used in the same way to estimate the federal income tax brackets for 2010. The CPI-U for the 12 months ending in August 2009 was 214.002, which was only 0.19 percent higher than the previous annual average of 213.605. This resulted in only very slight increases in these tax brackets for 2010. (See table 3.)
| Marginal tax rate (in percent) | Tax brackets |
|---|---|
10 |
Under $16,750 |
15 |
$16,751–$68,000 |
25 |
$68,001–$137,300 |
28 |
$137,301–$209,250 |
33 |
$209,251–$373,650 |
35 |
Over $373,650 |
Again, tying changes in the tax brackets to the CPI has the effect of preventing taxpayers from being moved into higher marginal tax brackets for increases in income that do not exceed inflation. Similarly, this legislation has the effect of reducing taxes over time for families on a fixed income. For example, if a family made a constant $67,000 in 2008, 2009, and 2010, their real income has fallen because their income has not kept pace with inflation. Since tax brackets are tied to the CPI, the federal tax burden for this family actually fell from 2008 to 2010, and its marginal tax rates dropped from 25 percent in 2008 to 15 percent in 2010.
How the CPI-U affects standard deduction amounts and personal exemption amounts
Taxpayers who do not itemize can instead use a "standard deduction" amount to reduce the amount of income subject to federal tax. Similarly, "personal exemption" amounts can be deducted for each eligible member of the taxpayer's family. Similarly to the federal tax brackets, these federal tax parameters are also tied to annual changes in the CPI-U for each 12-month period ending in August. (See table 4.)
| Tax year | Standard deduction amount | Personal exemption amount |
|---|---|---|
2008 |
$10,900 | $3,500 |
2009 |
11,400 | 3,650 |
2010 |
11,400 | 3,650 |
Note that, as with the tax brackets, the increase in standard deduction and personal exemption amounts rose more than four percent from 2008 to 2009. However, since the annual average CPI-U rose less than 0.2 percent for the next 12-month period, the standard deduction and personal exemption amounts (after rounding down to the next $50 amount), remained unchanged from 2009 to 2010.
Current Price Trends: Decline in Energy Prices Dominates Second Quarter Retail Inflation Picture
All items
The all items Consumer Price Index for All Urban Consumers (CPI-U) declined at a 1.5-percent seasonally adjusted annual rate (SAAR) during the second quarter of 2010.[3] For the first 6 months of 2010, the index has declined at a 0.3-percent SAAR. This compares with an increase of 2.7 percent in 2009. (See chart 1.)
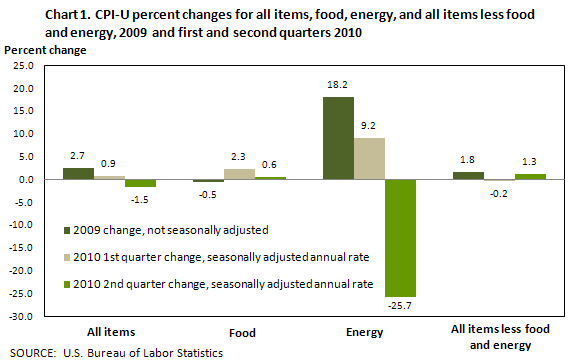
A downturn in the energy index is the main cause of the decline in the all items index thus far in 2010, but a deceleration in the index for all items less food and energy in the first quarter of the year is notable as well. The energy index rose significantly in 2009 but has declined so far in 2010. The index for all items less food and energy has risen so far in 2010, but at a rate lower than recent historical norms. In contrast, the food index has risen modestly in 2010 after declining in 2009.
Energy
Energy, typically, has been the most volatile of the major CPI components. It declined at a 25.7-percent SAAR in the second quarter of 2010 after rising at a 9.2-percent rate in the first quarter. (The monthly index has actually been declining since January.) For the first 6 months of 2010, the energy index has declined at a 9.9-percent SAAR after increasing 18.2 percent in 2009.
Within the energy component, the gasoline index fell at a 38.9-percent SAAR in the second quarter of 2010. This decline followed an increase at an 8.6-percent rate in the first quarter and a 53.5-percent rise over all of 2009. Sharp changes in gasoline prices are often a major factor in short-term CPI movements. Over the past few years, crude oil prices–and subsequently retail gasoline prices—have been quite volatile. From July 2007 to July 2008, gasoline prices rose sharply, increasing 37.9 percent; crude oil prices peaked in July 2008 at more than $134 a barrel. During the last 5 months of 2008, as crude oil prices collapsed to under $32 a barrel, retail gasoline prices fell by more than 50 percent. In 2009, pump prices turned sharply higher again, increasing more than 50 percent, with crude oil prices increasing to around $70 by the end of 2009.[4]
The household energy index also turned down in the second quarter of 2010, falling at a 10.1-percent rate after rising at an 8.9-percent rate in the first quarter. All the major components of household energy declined in the second quarter after rising in the first. The sharpest downturn was in the natural gas index, which declined at a 17.7-percent SAAR in the second quarter after rising at a 29.8-percent annual rate in the first quarter. The electricity index turned down as well, falling at a 7.1-percent SAAR in the second quarter of 2010 after rising at a 2.0-percent rate in the first quarter. For 2010 so far, the natural gas index has risen at a 3.4-percent annual rate after falling 18.1 percent in 2009, while the electricity index has fallen at a 2.7-percent rate after falling 0.5 percent in 2009. The fuel oil index fell at an 8.9–percent rate in the second quarter after rising at an 18.2-percent rate in the first.
Food
Food prices rose at a 0.6-percent SAAR in the second quarter of 2010 after rising at a 2.3-percent rate in the first quarter. The food index had declined 0.5 percent in 2009. Grocery store food prices, which rose at a 3.7-percent rate in the first quarter, were flat in the second quarter.[5] Of the six major grocery store food groups, only the meats, poultry, fish, and eggs group increased in second quarter. It rose at a 12.0-percent rate after rising at a 4.1-percent rate in the first quarter. Within this group, the beef and veal index (22.2 percent SAAR) and the pork index (16.6 percent SAAR) increased most rapidly. The other food at home groups posted declines, with fruits and vegetables falling the sharpest, at a 9.9-percent rate. The indexes for fresh fruits (at −16.9 percent SAAR) and fresh vegetables (at −9.0 percent SAAR) both declined sharply in the second quarter. Part of the decrease in the fresh vegetables index can be attributed to tomato prices, which dropped sharply in the second quarter after rising sharply in the first.
The other grocery store food groups decreased more modestly in the second quarter. Cereals and bakery products fell at the same 2.8-percent SAAR in the second quarter as it did in the first. Dairy and related products fell at a 1.7-percent rate after rising in each of the previous two quarters. The Nonalcoholic beverages index declined at a 2.6-percent rate, its fifth consecutive quarterly decline. Other food at home fell at a 0.5-percent SAAR in the second quarter.
Food away from home rose at 1.4-percent rate in the second quarter after rising at a 0.4-percent rate in the first. It has risen just 1.2 percent over the past year after rising at an average 3.6-percent rate over the previous 5 years.
Grocery store prices have risen in 2010 after falling through much of 2009, but the current rate of increase is still below the recent historical average. From November 2002 to November 2007, grocery store food prices rose at a 3.1-percent average annual rate. They then accelerated, increasing 7.0 percent from November 2007 to November 2008. In the next 12 months, however, the index turned down, falling 2.9 percent, the sharpest annual drop since June 1959. Since then, the food at home index has risen at a 2.0-percent rate (seasonally adjusted). Currently none of the six major grocery store food groups have increased or decreased more than 2.0 percent over the last 12 months.
All items less food and energy
The index for all items less food and energy rose at a 1.3-percent rate in the second quarter of 2010 after falling at a 0.2-percent annual rate in the first quarter. Much of the reversal can be attributed to the shelter index, which rose at a 0.9-percent rate in the second quarter after falling at a 2.2-percent rate in the first. Within shelter, rent rose at a 0.4-percent SAAR in the second quarter and owners' equivalent rent rose at a 0.3-percent rate. Lodging away from home rose at a 23.1-percent rate after falling in the first quarter.
Several other indexes turned up in the second quarter as well. The sharpest upturn was the airline fare index, which rose at a 14.3-percent rate in the second quarter after declining at a 10.9-percent rate in the first. Similarly, the new vehicles index turned up in the second quarter, rising at a 0.4-percent rate after declining at a 1.2-percent rate in the first. Apparel, down at a 4.5-percent rate in the first quarter, rose at a 1.3-percent rate in the second, and Recreation rose at a 1.4-percent rate in the second quarter after falling at a 1.0-percent rate in the first.
Household furnishings and operations continued to decline in the second quarter of 2010, falling at the same 3.7-percent rate as it did in the first quarter, and the index for communication turned down, falling at a 1.3-percent rate after rising slightly in the first quarter. Used cars and trucks, which rose at an 11.4-percent SAAR in the first quarter, continued to advance in the second quarter but decelerated, rising at a 6.6-percent rate. The medical care index also decelerated in the second quarter, rising at a 2.3-percent rate after increasing at a 5.7-percent rate in the first. In contrast, the tobacco index accelerated in the second quarter, rising at a 9.9-percent rate after increasing at 1.8-percent rate in the first.
The rate of inflation for all items less food and energy has slowed recently. For the 5-year period from August 2003 to August 2008, the index for all items less food and energy increased at a 2.3-percent annual rate. (A very similar result holds if the period is extended back 10 or 15 years.) Since August 2008, however, the average annualized increase has fallen by nearly half, to 1.2 percent. (See chart 2.)
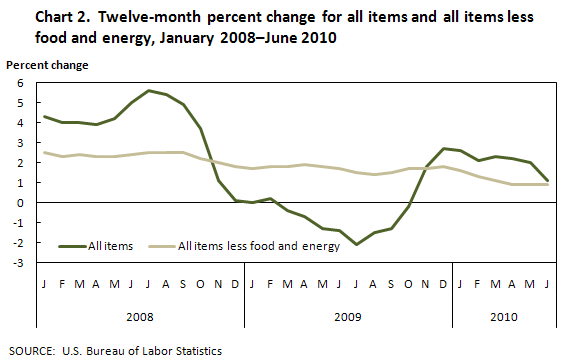
Much of this slower rate of inflation for the all items less food and energy index is attributable to the slowdown in the index for shelter, which is heavily weighted in the CPI. After increasing at a 3.0-percent average rate for the August 2003–08 period, the shelter index has risen at only a 0.2-percent annual rate since. Other indexes have decelerated as well, however, including airline fares and household furnishings and operations, which both turned down, as well as recreation, education, and medical care.
In contrast, some indexes within all items less food and energy actually accelerated recently. These include the tobacco index, which has risen sharply of late, in part due to excise tax increases, and the indexes for new vehicles and for used cars, which have both turned up after declining in the earlier period. Table 5 compares the changes of selected categories within all items less food and energy for the August 2003–August 2008 and August 2008–June 2010 periods.
| Category | August 2003— August 2008 (1) |
August 2008— June 2010 (seasonally adjusted) (2) |
Difference col. 2 − col. 1 |
|---|---|---|---|
Airline fares |
5.3 | −4.1 | −9.4 |
Household furnishings and operations |
2.0 | −1.3 | −3.3 |
Shelter |
3.0 | 0.2 | −2.8 |
Recreation |
1.1 | 0.0 | −1.1 |
All items less food and energy |
2.3 | 1.2 | −1.1 |
Education |
6.1 | 5.1 | −1.0 |
Medical care |
4.1 | 3.5 | −0.6 |
Apparel |
−0.2 | −0.1 | 0.1 |
Communication |
−1.0 | −0.3 | 0.7 |
New vehicles |
−0.5 | 1.3 | 1.8 |
Used cars and trucks |
−1.4 | 4.1 | 5.5 |
Tobacco |
4.8 | 17.8 | 13.0 |
Price movements described in this text reflect data as released on July 16, 2010. All 12-month and longer percent changes reflect not seasonally adjusted data except as noted. Percent changes covering less than a year are based on seasonally adjusted annual rates, unless otherwise noted. CPI seasonally adjusted indexes and percent changes are subject to annual revision.
Further information is available from the CPI Information and Analysis section, at cpi_info@bls.gov or (202) 691-7000.
Notes
[1] See http://www.irs.gov/pub/irs-soi/10winbulindincretpre.pdf (visited July 28, 2010).
[2] More precisely, each annual average is compared to an earlier initial base period, and the resulting numbers are rounded down to the next $50.
[3] Data in text, charts and tables are the latest available at the time of publication. Internet links may lead to more recent data.
[4] Energy Information Administration; see http://tonto.eia.doe.gov/dnav/pet/pet_pri_wco_k_w.htm (visited July 28, 2010).
[5] The six major grocery store food groups are: Cereals and bakery products; Meats, poultry, fish and eggs; Dairy and related products; Fruits and vegetables; Nonalcoholic beverages and beverage materials; and Other food at home.