
Focus on Prices and Spending | Import and Export Prices | Volume 1, Number 5
On this page
Current Price Topics: China's Exchange Rate Policy Reflected in U.S. Import Prices
On June 19, 2010, China's central bank announced that it would allow the renminbi, or yuan, as it is widely known, to float more freely against the U.S. dollar. As of July 9, the value of the yuan hit a new high in intra-day trading, but has appreciated less than 1 percent against the dollar. However, because of the influence this policy shift could have on the price of goods traded between the two countries, some analysts expect continued yuan appreciation to favorably affect the U.S. trade deficit with China.[1]
The competitiveness of U.S. imports and exports is affected, in part, by the effect of foreign currency fluctuations on the relative price of goods. If, for example, the yuan were permitted to float freely in the market and strengthened against the dollar, as it did during China's last period of currency float, then presumably the price of its exports would rise in relation to goods produced in the United States. Similarly, a stronger yuan would make U.S. goods less expensive for China to import, and thus demand for U.S. exports could rise.
To help track the yuan exchange rate's impact on trade, the Bureau of Labor Statistics (BLS) releases a price index, known as the China Locality of Origin (LOO) index that shows the average price movement for goods imported from China each month. Similar to the BLS monthly import and export price indexes (MXP), the China LOO price index measures price inflation for products imported into the United States in U.S. dollar terms.[2]
Since the inception of the China LOO price index in December 2003, the prices of goods imported from China have been virtually unchanged, compared with a 30.2-percent increase for all imports. However, a closer examination of the BLS China LOO price series from the December 2003–June 2010 period illustrates a more interesting picture of economic events and exchange rate policy shifts taken by China's government over the same period. The China LOO price index declined 2.6 percent from December 2003 to March 2007. (See chart 1.) During much of this period, China followed a policy of exchange rate stability in which its currency was informally pegged to the U.S. dollar at a central parity rate above or below which the yuan could fluctuate by 0.5 percent. This stable exchange rate effectively contributed to the lower cost of imports from China into the United States. In comparison, the index for all imported goods increased by 18.9 percent over the same period.

In July 2005, China changed its policy and allowed the yuan to gradually appreciate in value. China had previously been maintaining the yuan at approximately 8.28 yuan to the dollar by printing yuan to purchase dollar-denominated assets. However, in 2005, China instituted a managed float of the yuan against a basket of foreign currencies. Subsequently, the dollar depreciated nearly 17 percent against the yuan from July 2005 to July 2008.
From July 2005 to the spring of 2007, the China LOO tracked the yuan's movement in the market. However, in June 2007 the China LOO price index began an unprecedented climb coinciding roughly with the onset of the global economic and financial crisis.[3] From June 2007 until August 2008, the price of goods from China increased 5.8 percent. However, in the summer of 2008, when China froze the yuan again in response to this crisis, the China LOO price index showed an immediate and dramatic downturn, declining 3.3 percent over the next 8 months before stabilizing from April 2009 to the present.
While exchange rates can affect prices of goods traded between countries, not all of the change in currency will be evident through import prices. For example, the BLS Japan LOO price index displays a useful comparison of import price change from a different U.S. major trade partner in Asia. (See chart 2.) Similar to China, Japan also predominantly exports finished goods, whose prices tend to be less volatile than those of raw materials. The import prices from Japan have increased by only 3.4 percent compared with an average 30.2 percent increase for all imports since December 2003. However, because the Japanese yen's exchange rate is determined in financial markets, the currency floats freely against the U.S. dollar, and thus other factors can play a more important role in determining the prices of Japan's exported goods. As a result, the yen's value varies widely against the dollar, yet the Japan LOO price index fluctuates in a less dramatic fashion than overall import prices. From December 2003 to the onset of the global financial crisis, the Japan LOO price index increased by less than 1 percent. Over this period, however, the yen's value varied widely in both month-to-month and in absolute terms. During the global financial crisis, Japan worked in coordination with the U.S. Federal Reserve and other international central banks in August 2007 to inject 1 trillion yen into the financial markets to increase available liquidity. This caused an immediate strengthening of the yen against the dollar. After several fluctuations in the currency's value, the yen ultimately appreciated 25 percent from its high in June 2007 to June 2010. However, prices of imports from Japan increased only 4 percent over this period.

China's recent exchange rate policy decision will undoubtedly be seen reflected in the import prices measured by the China LOO price index in the coming months. However, other factors, such as labor costs, input prices, and China's export product mix will also have an impact on the index. In fact, as China's industry base diversifies away from the production of low-tech consumer goods towards a broader spectrum of goods and services, evaluating the effect of this shift in a more detailed China LOO price index in the future would be valuable.
In addition to the China and Japan LOO price indexes, BLS publishes 12 other LOO price indexes, 6 of which are further broken out by manufactured and nonmanufactured products.[4] These unique indexes contribute to a better measurement of price competitiveness of U.S. imports by global region.
Current Price Trends: Quarterly Price Highlights
Import Prices
Import prices fell 0.7 percent in the second quarter of 2010 after rising 1.5 percent for the quarter ended in March. The decline between March and June was the first quarterly downturn since the first quarter of 2009. The decline in the second quarter was led by a 5.5-percent drop in fuel prices, which more than offset a 0.5-percent increase in nonfuel prices.
Fuel Import Prices
Fuel prices started out the second quarter of 2010 by rising 2.6 percent in April, but fell 4.1 percent and 4.0 percent, respectively, in May and June to finish the quarter down 5.5 percent. The downturn for the March–June quarter broke the trend of increasing fuel prices dating back to a 55.6-percent plunge during the final quarter of 2008. Both petroleum and natural gas prices fell during the second quarter, with the price index for petroleum imports accounting for approximately 85 percent of the overall drop. Petroleum prices declined 5.1 percent for the quarter while natural gas prices decreased 16.0 percent.
The major factor for the drop in petroleum prices during May and June has been the European debt crisis that resulted in the Euro falling 10.3 percent against the U.S. dollar between April 30 and June 8. Petroleum is priced in U.S. dollars, so a rise in the value of the dollar made petroleum more expensive in foreign currency terms and subsequently led to a drop in the dollar price.[5] In addition, petroleum demand in Europe also continued to lag. Despite the fact demand has been weak in Europe, global demand did increase, according to a revised report submitted on June 10 by the International Energy Agency, with most of the demand growth coming from Asia and North America.[6] Natural gas prices also fell in the second quarter, largely due to reduced demand between the winter heating and summer cooling seasons.
Nonfuel Import Prices
In contrast to fuel prices, nonfuel import prices rose in the second quarter of 2010, increasing 0.5 percent following a 0.6-percent advance during the previous quarter. As seen in chart 3, the price index for industrial supplies and materials accounted for most of the increase. Higher prices for foods, feeds, and beverages and automotive vehicles also contributed some to the overall price increase, but those advances were more than offset by falling prices for consumer goods and capital goods.

Prices for nonfuel industrial supplies and materials rose 3.4 percent from March to June, led by a 5.9-percent increase in unfinished metals prices. Despite declining during the final month of the second quarter, prices for unfinished metals have trended up since the first quarter of 2009. Major contributors to the increase in metals prices included a 10.7-percent rise in iron and steel mill prices and an 11.6-percent advance in steelmaking materials. The price increase in steelmaking materials resulted from an increase in demand stemming from greater steel production in China.[7]
The price index for foods, feeds, and beverages increased 0.7 percent during the second quarter; a 6.6-percent increase in fish and shellfish prices drove the advance. The Gulf oil spill has led to a reduction in seafood, most notably shrimp and oysters, available out of the Gulf of Mexico, thus increasing the demand for imported seafood. Typically, imports account for approximately 83 percent of the seafood consumed in the United States.[8]
Finished goods prices were mostly down during the March–June quarter, with consumer goods prices and prices of capital goods falling 0.3 percent and 0.1 percent, respectively, even while the price index for automotive vehicles ticked up 0.1 percent. The rising value of the U.S. dollar, which increased 4.9 percent against a trade-weighted basket of major currencies from March 1 to June 1, put downward pressure on imported finished goods prices during the second quarter. An increase in the value of the U.S. dollar makes import prices cheaper.[9]
Export Prices
The price index for U.S. exports rose 1.4 percent for the quarter ended in June, following a similar advance for the first quarter of 2010. The second quarter increase continues an upward trend dating back to the second quarter of 2009. Rising prices for both nonagricultural exports and agricultural exports each contributed to the overall increase in the second quarter. A 1.5-percent advance in nonagricultural prices accounted for approximately 94 percent of the rise in export prices, while agricultural prices rose 1.0 percent.
Agricultural Export Prices
The price index for agricultural exports rose 1.0 percent for the quarter ended in June following a 0.9-percent decline for the first quarter of 2010. A 7.7-percent increase in meat prices led the advance, although higher prices for exported fruit, cotton, and nuts also contributed to the overall increase. Meat prices were led by higher prices for pork as hog slaughter rates in the United States fell the first quarter of the year and weights were lower than expected leading to higher prices. Although both supply factors improved in the second quarter, pork prices continued to rise.[10] Corn and wheat prices fell 7.2 percent and 7.7 percent, respectively, in the second quarter, partially offsetting the increasing pork prices.
Nonagricultural Export Prices
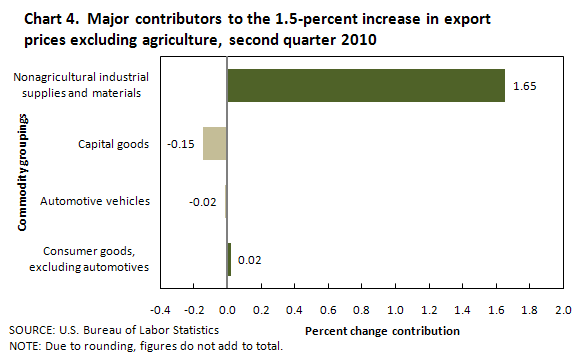
Nonagricultural export prices rose 1.5 percent in the second quarter following a similar advance between December 2009 and March 2010. Chart 4 shows the increase was almost entirely driven by higher prices for nonagricultural industrial supplies and materials. In contrast, finished goods prices, including capital goods, consumer goods, and automobiles, were down overall and partially offset the rising prices for nonagricultural industrial supplies and materials. Falling capital goods prices were the primary contributor to the drop in finished goods prices.
Nonagricultural industrial supplies and materials prices rose 5.1 percent for the quarter ended in June, the largest quarterly increase since a 7.2-percent increase for the first quarter of 2008. The 2010 second quarter advance was led by a 15.2-percent increase in fuel prices. Despite a 2.8-percent decrease in export petroleum prices, a 115.2-percent jump in coal prices drove overall fuel prices up for the quarter. Coal prices have risen because of strong demand from China; that country's coal imports were up 165 percent on a yearly basis as of March 2010.[11]
Capital goods prices fell 0.4 percent in the second quarter, reversing the 0.5-percent increase for the previous quarter. The largest contributor to the decrease was a 1.6-percent decline for the price index for computers, peripherals, and semiconductors. Prices for automotive vehicles also fell in the second quarter, edging down 0.1 percent. The exception to the declining price trend for export finished goods for the quarter was consumer goods, for which prices rose 0.2 percent between March and June.
For further information, please contact Rozi Ulics at (202) 691-7114 or by email at Ulics.Rozi@bls.gov or Dave Mead at (202) 691-7101 or by email at Mead.Dave@bls.gov.
Notes
[1] See "China's central bank says it's ready to free up currency, making trade partners happy," The Washington Post, June 20, 2010.
[2] The average exchange rate index that BLS uses to convert import prices for goods priced in a foreign currency into U.S. dollar terms is lagged 1 month. The BLS reference period for the MXP and LOO price indexes is the first of the month. Therefore, the exchange rate used for the currency conversion is the average exchange rate for the month prior to the reference period.
[3] See "Timeline: Credit crunch to downturn," BBC News, Aug. 7, 2009.
[4] For more information on these publications see http://www.bls.gov/web/ximpim/coor.htm.
[5] See "Oil falls to near $76 a barrel as traders eye euro," The Associated Press, May 11, 2010; and "Oil prices settle near $77 as stocks, euro rise," The Associated Press, June 15, 2010.
[6] Oil Market Report (International Energy Agency, 10 June, 2010). Also, for more information about the International Energy Agency, see http://www.iea.org/about/index.asp.
[7] See "Producers set to push up steel prices higher," Chinadaily.com.cn, Apr. 15, 2010.
[8] See "Jumbo problems for shrimp amid Gulf oil spill; wholesale prices climb," The Associated Press, June 15, 2010; and "Impact on seafood prices is limited," The Wall Street Journal, June 21, 2010.
[9] Focus on Prices and Spending; Import and Export Prices: First quarter 2010 (U.S. Bureau of Labor Statistics, May 2010, Volume 1, Number 1).
[10] World Agricultural Supply and Demand Estimates (U.S. Department of Agriculture, Mar.10, 2010) and Quarterly Hogs and Pigs Report (U.S. Department of Agriculture, June 25, 2010).
[11] See "China ignites global coal market," The Wall Street Journal, May 4, 2010.