Ovarian Cancer Rates by State
In the following maps, states in the U.S. are divided into groups based on the rates at which women developed or died from ovarian cancer in 2008, the most recent year for which statistics are available.
Rates of Getting Ovarian Cancer by State
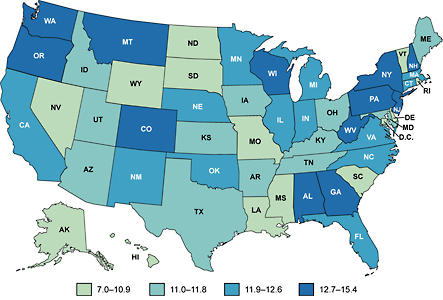
Incidence refers to the number of women who get a disease each year. In the United States, the number of women who get ovarian cancer varies from state to state. The map below shows the incidence of ovarian cancer by state in 2008.
Ovarian Cancer Incidence Rates* by State, 2008†
| Color on Map | Interval | States |
|---|---|---|
| Light green | 7.0 to 10.9 | Alaska, Delaware, District of Columbia, Hawaii, Louisiana, Mississippi, Missouri, Nevada, North Dakota, Rhode Island, South Carolina, South Dakota, Vermont, and Wyoming |
| Medium green | 11.0 to 11.8 | Arizona, Arkansas, Idaho, Iowa, Kansas, Kentucky, Maine, Maryland, Ohio, Tennessee, Texas, and Uta |
| Medium blue | 11.9 to 12.6 | California, Connecticut, Florida, Illinois, Indiana, Massachusetts, Michigan, Minnesota, Nebraska, New Mexico, North Carolina, Oklahoma, and Virginia |
| Dark blue | 12.7 to 15.4 | Alabama, Colorado, Georgia, Montana, New Hampshire, New Jersey, New York, Oregon, Pennsylvania, Washington, West Virginia, and Wisconsin |
*Rates are per 100,000 and are age-adjusted to the 2000 U.S. standard population.
†Source: U.S. Cancer Statistics Working Group. United States Cancer Statistics: 1999–2008 Incidence and Mortality Web-based Report. Atlanta (GA): Department of Health and Human Services, Centers for Disease Control and Prevention, and National Cancer Institute; 2012. Available at: http://www.cdc.gov/uscs. (full site)
Deaths from Ovarian Cancer by State
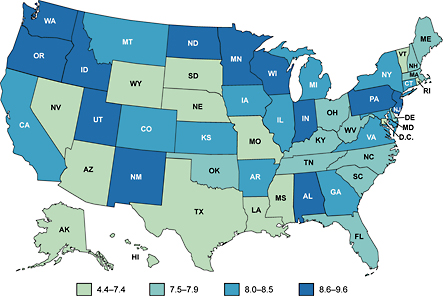
Rates of dying from ovarian cancer also vary from state to state.
Ovarian Cancer Death Rates* by State, 2008†
| Color on Map | Interval | States |
|---|---|---|
| Light green | 4.4 to 7.4 | Alaska, Arizona, District of Columbia, Hawaii, Louisiana, Mississippi, Missouri, Nebraska, Nevada, Rhode Island, South Dakota, Texas, Vermont, and Wyoming |
| Medium green | 7.5 to 7.9 | Delaware, Florida, Kentucky, Maine, Massachusetts, New Hampshire, North Carolina, Ohio, Oklahoma, South Carolina, Tennessee, and West Virginia |
| Medium blue | 8.0 to 8.5 | Arkansas, California, Colorado, Connecticut, Georgia, Illinois, Iowa, Kansas, Maryland, Michigan, Montana, New York, and Virginia |
| Dark blue | 8.6 to 9.6 | Alabama, Idaho, Indiana, Minnesota, New Jersey, New Mexico, North Dakota, Oregon, Pennsylvania, Utah, Washington, and Wisconsin |
*Rates are per 100,000 and are age-adjusted to the 2000 U.S. standard population. Rates are suppressed if fewer than 16 cases were reported in a state.
†Source: U.S. Cancer Statistics Working Group. United States Cancer Statistics: 1999–2008 Incidence and Mortality Web-based Report. Atlanta (GA): Department of Health and Human Services, Centers for Disease Control and Prevention, and National Cancer Institute; 2012. Available at: http://www.cdc.gov/uscs. (full site)
Contact Us:
- Centers for Disease Control and Prevention
Division of Cancer Prevention and Control
4770 Buford Hwy NE
MS K-64
Atlanta, GA 30341 - 800-CDC-INFO
(800-232-4636)
TTY: (888) 232-6348
8am–8pm ET
Monday–Friday
Closed on Holidays - cdcinfo@cdc.gov
