News Release Information
12 1520 NEW
Wednesday, July 25, 2012
Contacts
Technical information:
- (646) 264-3620
- BLSInfoNY@bls.gov
- www.bls.gov/ro2
Media contact:
- Martin Kohli (646) 264-3620
Average Energy Prices in New York-Northern New Jersey – June 2012
New York area consumers paid prices well above the U.S. city average for electricity and utility (piped) gas in June, as measured by the Consumer Price Index (CPI), the U.S. Bureau of Labor Statistics reported today. Electricity prices were 50.4 percent higher in New York than nationwide, and area utility (piped) gas prices were 21.3 percent higher. In comparison, the price of gasoline was 2.9 percent higher than the national average. Martin Kohli, the Bureau’s chief regional economist, noted that the percent differences between area and national prices for both electricity and utility (piped) gas were very close to what they were in June 2011. (See table A. Data in this release are not seasonally adjusted; accordingly, over-the-year analysis is used throughout.)
| Energy product | June 2011 | June 2012 | ||||
|---|---|---|---|---|---|---|
| United States | New York area | Percent difference | United States | New York area | Percent difference | |
Electricity (per KWH) |
$0.134 | $0.204 | 52.2 | $0.135 | $0.203 | 50.4 |
Utility (piped) gas (per therm) |
1.077 | 1.296 | 20.3 | 0.927 | 1.124 | 21.3 |
Gasoline (per gallon) |
3.753 | 3.952 | 5.3 | 3.602 | 3.706 | 2.9 |
|
NOTE: A positive percent difference measures how much the price in the New York area is above the national price, while a negative difference reflects a lower price in the New York area. |
||||||
A kilowatt-hour (kWh) of electricity cost New York area consumers $0.203 in June 2012, little changed from the previous year, down 0.5 percent. Nationwide, electricity prices were nearly unchanged over the same period, up 0.7 percent. For the past five years, electricity prices in the New York area have been 38.2 percent or more above national averages. (See chart 1.)

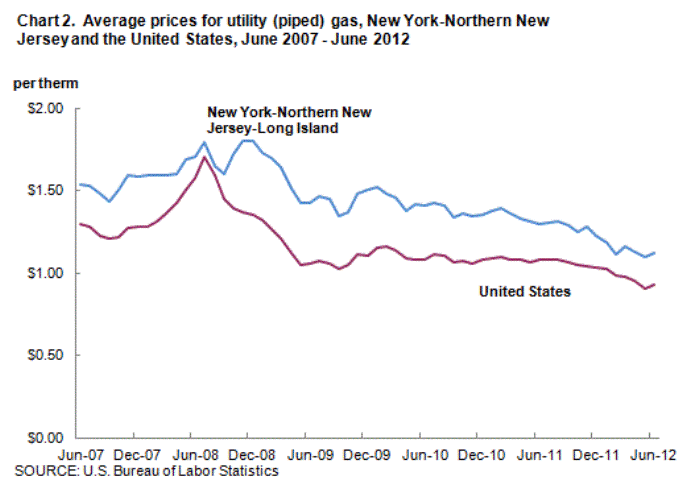
A therm—a measure of constant heating value—of utility (piped) gas, commonly referred to as natural gas, in the New York area averaged $1.124 in June 2012, a decline of 13.3 percent from the previous June. Nationwide, a therm averaged $0.927 in June 2012, a decrease of 13.9 percent over the year. Since June 2010, the gap in natural gas prices between New York and the nation has typically been between 20 and 30 percent. (See chart 2.)
In June 2012, a gallon of gasoline averaged $3.706 in the New York area, a decrease of 6.2 percent from one year earlier. Nationally, gasoline averaged $3.602, a 4.0-percent decline. For most of the past five years, gasoline prices in the area have been within 5.0 percent of the national level. (See chart 3.)

The New York-Northern New Jersey-Long Island, N.Y.-N.J.-Conn.-Pa. consolidated area covered in this release is comprised of Bronx, Dutchess, Kings, Nassau, New York, Orange, Putnam, Queens, Richmond, Rockland, Suffolk, and Westchester Counties in New York State; Bergen, Essex, Hudson, Hunterdon, Mercer, Middlesex, Monmouth, Morris, Ocean, Passaic, Somerset, Sussex, Union, and Warren Counties in New Jersey; Fairfield County and parts of Litchfield, Middlesex, and New Haven Counties in Connecticut; and Pike County in Pennsylvania..
Additional information
Information in this release will be made available to sensory impaired individuals upon request. Voice phone: 202-691-5200; TDD message referral phone number: 800-877-8339.
Technical Information
Average prices for electricity, utility (piped) gas, and gasoline are published monthly for the U.S. city average, the 4 regions, the 3 population size classes, 10 region/size-class cross-classifications, and the 14 largest local index areas. For electricity, average prices per kilowatt-hour (kWh) and per 500 kWh are published. For utility (piped) gas, average prices per therm, per 40 therms, and per 100 therms are published. For gasoline, the average price per gallon is published. Average prices for commonly available grades of gasoline are published as well as the average price across all grades.
Price quotes for 40 therms and 100 therms of utility (piped) gas and for 500 kWh of electricity are collected in sample outlets for use in the average price programs only. Since they are for specified consumption amounts, they are not used in the CPI. All other price quotes used for average price estimation are regular CPI data.
With the exception of the 40 therms, 100 therms, and 500 kWh price quotes, all eligible prices are converted to a price per normalized quantity. These prices are then used to estimate a price for a defined fixed quantity.
| Year and month | Electricity per kilowatt hour | Utility (piped) gas per therm | Gasoline, all types, per gallon | |||
|---|---|---|---|---|---|---|
| U.S. city average | New York-Northern New Jersey | U.S. city average | New York-Northern New Jersey | U.S. city average | New York-Northern New Jersey | |
| 2011 | ||||||
June |
$ 0.134 | $ 0.204 | $ 1.077 | $ 1.296 | $ 3.753 | $ 3.952 |
July |
0.135 | 0.210 | 1.078 | 1.307 | 3.703 | 3.896 |
August |
0.135 | 0.200 | 1.079 | 1.309 | 3.680 | 3.886 |
September |
0.135 | 0.205 | 1.063 | 1.288 | 3.664 | 3.818 |
October |
0.130 | 0.191 | 1.047 | 1.251 | 3.521 | 3.655 |
November |
0.128 | 0.188 | 1.044 | 1.277 | 3.475 | 3.597 |
December |
0.127 | 0.184 | 1.034 | 1.227 | 3.329 | 3.486 |
| 2012 | ||||||
January |
0.128 | 0.189 | 1.021 | 1.186 | 3.447 | 3.578 |
February |
0.128 | 0.186 | 0.986 | 1.112 | 3.622 | 3.767 |
March |
0.127 | 0.186 | 0.978 | 1.162 | 3.918 | 3.930 |
April |
0.127 | 0.185 | 0.951 | 1.125 | 3.976 | 4.054 |
May |
0.129 | 0.191 | 0.907 | 1.094 | 3.839 | 3.949 |
June |
0.135 | 0.203 | 0.927 | 1.124 | 3.602 | 3.706 |
Last Modified Date: July 26, 2012