Maps and Data
Find maps and charts showing transportation data and trends related to alternative fuels and vehicles.
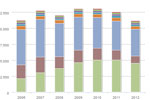
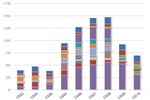
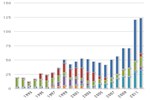
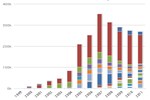
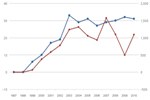
U.S. Corn Use by Market Year
| 2006 | 2007 | 2008 | 2009 | 2010 | 2011 | 2012 | |
| Seed | 23.744999999999997 | 21.841 | 21.945 | 22.337 | 23 | 24.41 | 25 |
| Alcohol for beverages | 135.82 | 135.3998672 | 134 | 134 | 135 | 135 | 137.21 |
| Cereals and food | 190.422 | 192.4 | 192.1 | 193.663 | 197 | 200.7 | 205 |
| Starch | 276.90291211 | 264.66435056 | 234.094 | 250.437 | 257.926 | 253.715 | 235 |
| Glucose and dextrose | 259.40789209 | 255.96262941 | 245.123 | 257.284 | 272.379 | 294.402 | 285 |
| High-fructose corn syrup | 535.32616075 | 522.76879366 | 489.064 | 512.125 | 521.055 | 512.744 | 465 |
| Feed and residual use | 5540.132 | 5857.7390000000005 | 5181.855 | 5124.703 | 4792.9349999999995 | 4561.682000000001 | 4150 |
| Exports | 2125.369 | 2437.402 | 1848.9470000000001 | 1980.0230000000001 | 1834.167 | 1543 | 1150 |
| Alcohol for fuel | 2119.4938519 | 3049.2140741 | 3708.88904 | 4591.157 | 5021.214 | 5000 | 4500 |
Source: USDA Economic Research Service - Feed Grains: Yearbook (Tables #3 and #31)
Notes: "Residual" in the "Feed/Residual" category includes handling losses, unreported use, and estimating errors. Total used does not equal total produced, due to stock changes. Market Year starts in September of the given year and ends in August of the next year.
The amount of corn consumed by Americans (directly and processed) remains relatively constant every year at approximately 1,400 million bushels a year. The amount of corn devoted to exports, animal feed, and alcohol for fuel is more variable. These three seem to absorb the reduction during drought years, such as 2012, and seem to be interchangeable as alcohol has displaced an increasing amount of animal feed and exports in recent years.