NERSCPowering Scientific Discovery Since 1974

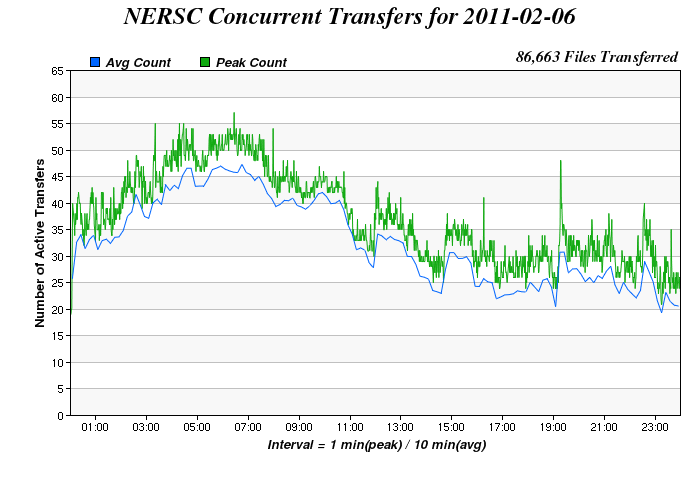
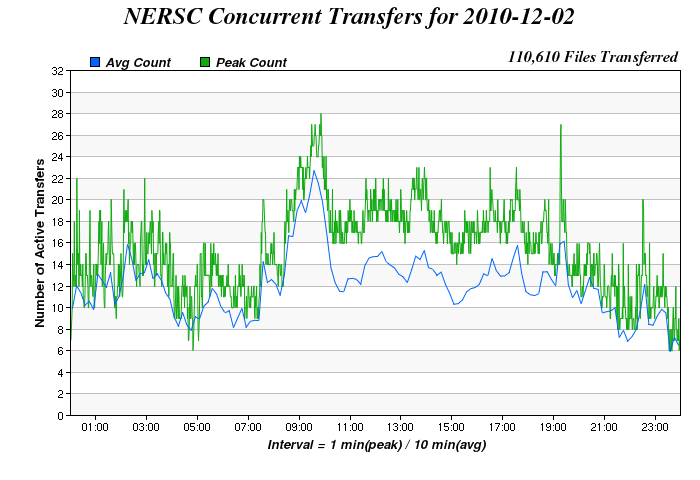
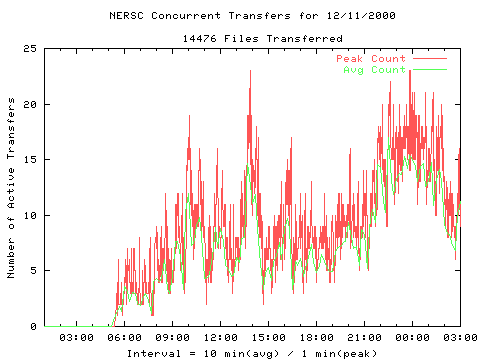
Concurrent Transfers Historical Yearly Peak


These plots show the yearly peak days from 2000 to present.


BE CAREFUL because the graphs are autoscaling - check the scales on each axis before you compare graphs.


Note that the graph for current year shows the data for the year-to-date peak.


Daily Storage Concurrency


Daily Storage Concurrency


Daily Storage Concurrency


Daily Storage Concurrency


Daily Storage Concurrency


Daily Storage Concurrency


Daily Storage Concurrency


Daily Storage Concurrency


Daily Storage Concurrency


Daily Storage Concurrency


Daily Storage Concurrency


Daily Storage Concurrency