2010-2012 Cetacean Unusual Mortality Event in Northern Gulf of Mexico

Under the Marine Mammal Protection Act of 1972 (as amended), an Unusual Mortality Event (UME) has been declared for cetaceans (whales and dolphins) in the northern Gulf of Mexico (Texas/ Louisiana border through Franklin County, FL) from February 2010 through the present.
Note: These numbers are preliminary and may be subject to change. As of October 7, 2012, the UME involves 779 Cetacean "strandings" in the Northern Gulf of Mexico (5% stranded alive and 95% stranded dead). Of these:
| Cetaceans Stranded | Phase of Oil Spill Response | Dates |
|---|---|---|
| 114 cetaceans stranded | prior to the response phase for the oil spill | February 1, 2010- April 29, 2010 |
| 122 cetaceans stranded or were reported dead offshore | during the initial response phase to the oil spill | April 30, 2010- November 2, 2010 |
| 543 cetaceans stranded* | after the initial response phase ended | November 3, 2010- October 7, 2012** |
*This number includes 6 dolphins that were killed incidental to fish related scientific data collection and 1 dolphin killed incidental to trawl relocation for a dredging project. |

Brucella bacteria
In addition to investigating all other potential causes, scientists are investigating what role Brucella may have in the Unusual Mortality Event.
Since our original finding of Brucella in 5 stranded dolphins from LA, scientists have been concentrating testing on cases that show pathological changes consistent with the fetal pneumonia or adult meningitis identified in the first 5 cases. Here are our results showing the total number of Brucella cases identified so far. We will update these numbers when new results are available.
FAQs
FAQs on the investigations of the ongoing dolphin die-off and the potential impacts of the Deepwater Horizon BP oil spill on marine mammals are available.
Data

All stranded cetaceans (dolphins and whales) from Franklin County, FL to the Texas/ Louisiana border by MONTH.
NOTE: Historical data from 2002-2009 excludes 2 previous UMEs in the panhandle of Florida (March-April, 2004 and Sept. 2005-April 2006). Historical data from 2008 through present are unvalidated and numbers may be subject to change as more information becomes available. Data include any strandings reported on or before October 7, 2012 and include 6 cases that were incidental scientific data collection takes and 1 take incidental to trawl relocation for a dredging project. Data from 2010 through 2012 are considered preliminary and may be subject to change as more information becomes available. Raw historical data are also available.
| Jan | Feb | Mar | Apl | May | Jun | Jul | Aug | Sep | Oct | Nov | Dec | |
| Average (2002-2009) | 6.6 | 6.9 | 17.9 | 11.5 | 5.3 | 3.6 | 4.1 | 3.5 | 4.0 | 4.0 | 2.6 | 3.8 |
| 2010 Total | 5 | 11 | 62 | 41 | 40 | 30 | 10 | 19 | 17 | 6 | 11 | 13 |
| 2011 Total | 25 | 62 | 72 | 39 | 20 | 23 | 17 | 30 | 16 | 26 | 19 | 13 |
| 2012 | 24 | 25 | 46 | 17 | 11 | 9 | 9 | 5 | 10 | 2 |
All stranded cetaceans (dolphins and whales) from Franklin County, FL to the Texas/Louisiana border by STATE.
**NOTE: Historical data from 2002-2009 excludes 2 previous UMEs in the panhandle of Florida (March-April, 2004 and Sept. 2005-April 2006). Historical data from 2008 through present are unvalidated and numbers may be subject to change as more information becomes available. Data include any strandings reported on or before October 7, 2012 and include 6 cases that were incidental scientific data collection takes and 1 take incidental to trawl relocation for a dredging project. Data from 2010 through 2012 are considered preliminary and may be subject to change as more information becomes available. Raw historical data are also available.
| FL Panhandle |
AL | MS | LA | |
|---|---|---|---|---|
| Average (2002-2009) | 20** | 14 | 20 | 20 |
| 2010 (Feb-Dec) | 33 | 25 | 64 | 138 |
| 2011 Total | 33 | 59 | 111 | 159 |
| 2012 (through October 7) | 24 | 19 | 34 | 81 |

All stranded bottlenose dolphins from Franklin County, FL to the Texas/ Louisiana border by month.
NOTE: Historical data from 2002-2009 excludes 2 previous UMEs in the panhandle of Florida (March-April, 2004 and Sept. 2005-April 2006). Historical data from 2008 through present are unvalidated and numbers may be subject to change as more information becomes available. Data include any strandings reported on or before August 19, 2012 and include 3 cases that were incidental scientific data collection takes and 1 take incidental to trawl relocation for a dredging project. Data from 2010 through 2012 are considered preliminary and may be subject to change as more information becomes available. Raw historical data are also available.
| Jan | Feb | Mar | Apl | May | Jun | Jul | Aug | Sep | Oct | Nov | Dec | |
| Average (2002-2009) | 5.4 | 6.6 | 16.6 | 10.4 | 4.8 | 3.1 | 3.3 | 2.8 | 2.0 | 3.3 | 1.8 | 2.8 |
| 2010 Total | 3 | 9 | 54 | 38 | 38 | 20 | 9 | 19 | 13 | 6 | 7 | 12 |
| 2011 | 24 | 58 | 67 | 36 | 18 | 21 | 17 | 25 | 12 | 24 | 18 | 10 |
| 2012 | 19 | 21 | 40 | 15 | 8 | 6 | 7 | 3 | 6 | 2 |

Stranded bottlenose dolphins from Franklin County, FL to the Texas/ Louisiana border with reported actual or estimated whole carcass lengths less than 115 cm (partial carcasses excluded). Bottlenose dolphins <115 cm in total length are either premature, stillborn, or neonatal.
NOTE: Historical data from 2002-2009 excludes 2 previous UMEs in the panhandle of Florida (March 2004-April 2004 and September 2005-April 2006). Historical data from 2008 through present are unvalidated and numbers may be subject to change as more information becomes available. Data include any strandings reported on or before October 7, 2012 and 1 case that was an incidental scientific data collection take. Data from 2010 through 2012 are considered preliminary and may be subject to change as more information becomes available. Raw historical data are also available.
| Jan | Feb | Mar | Apl | May | Jun | Jul | Aug | Sep | Oct | Nov | Dec | |
| Average (2002-2009) | 1 | 2 | 6.9 | 2.1 | 0.9 | 0.3 | 0 | 0 | 0.1 | 0 | 0.1 | 0.3 |
| 2010 Total | 0 | 1 | 11 | 9 | 4 | 1 | 0 | 1 | 0 | 0 | 0 | 2 |
| 2011 | 6 | 34 | 27 | 12 | 3 | 2 | 0 | 0 | 0 | 0 | 0 | 2 |
| 2012 | 9 | 9 | 11 | 2 | 0 | 0 | 0 | 0 | 0 | 0 |
2012: January 1-October 7, 2012
Map of Cetacean (Dolphin and Whale) Strandings in the Northern Gulf of Mexico

Bottlenose dolphins are shown as circles and other species as squares. Bottlenose dolphins with reported actual or estimated lengths of less than 115 cm are shown as a circle with a black dot inside. Pink markers show the most recent week of data while green markers are all other cases since January 1, 2012.
2011: January 1-December 31, 2011
Map of Cetacean (Dolphin and Whale) Strandings in the Northern Gulf of Mexico

Bottlenose dolphins are shown as circles and other species as squares. Bottlenose dolphins with reported actual or estimated lengths of less than 115 cm are shown as a circle with a black dot inside.
2010: February 1-December 31, 2010
Map of Cetacean (Dolphin and Whale) Strandings in the Northern Gulf of Mexico
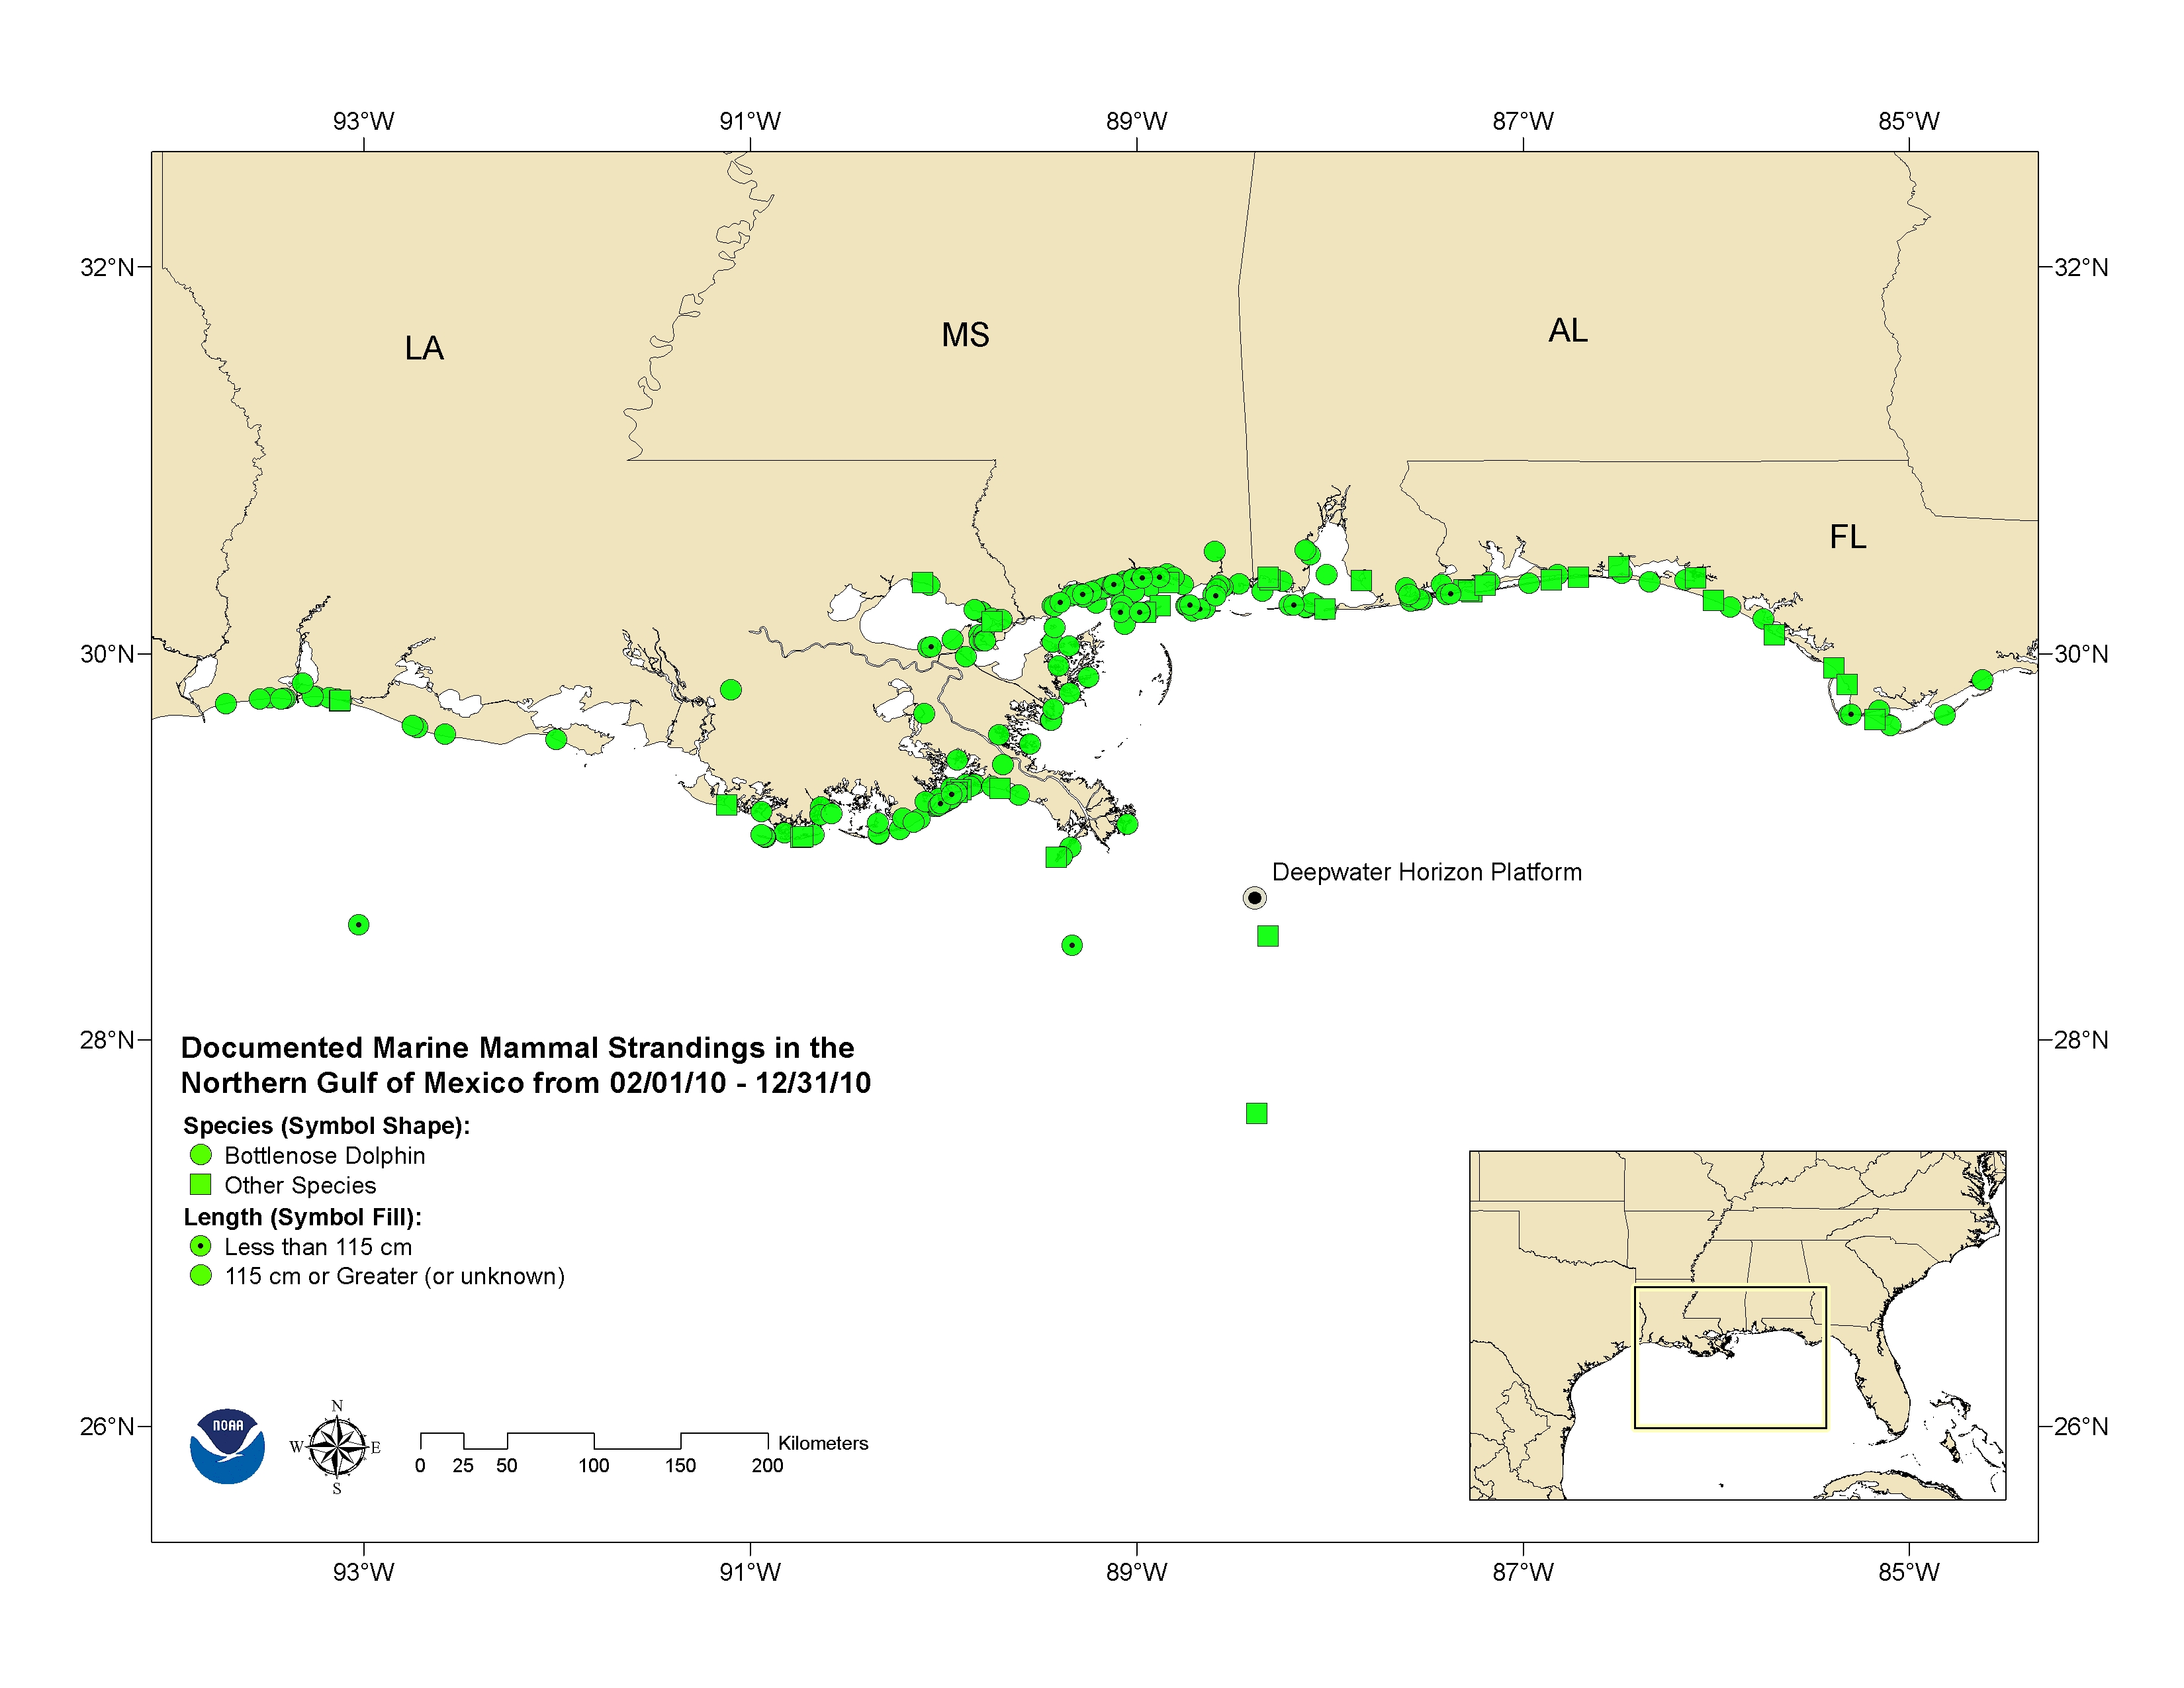
Bottlenose dolphins are shown as circles and other species as squares. Bottlenose dolphins with reported actual or estimated lengths of less than 115 cm are shown as a circle with a black dot inside.
More Information
- Download an Excel spreadsheet of the raw historical stranding data (2002-2009) in the northern Gulf of Mexico
- FAQs on the investigations
- NOAA finds bacterial infection as cause of death for five northern Gulf dolphins; investigation continues
Updated: October 11, 2012