|
Download Data (XLS File) |
|
||||||||
|
||||||||
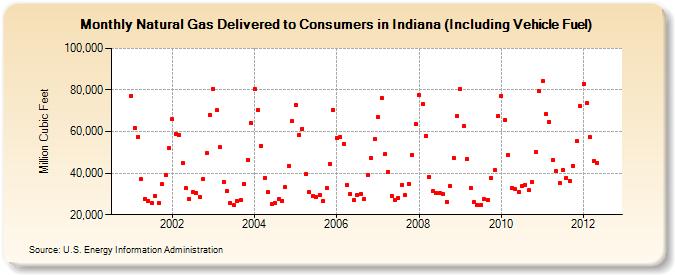
| Natural Gas Delivered to Consumers in Indiana (Including Vehicle Fuel) (Million Cubic Feet) | ||||||||
| Year | Jan | Feb | Mar | Apr | May | Jun | Jul | Aug | Sep | Oct | Nov | Dec |
|---|---|---|---|---|---|---|---|---|---|---|---|---|
| 2001 | 77,275 | 61,840 | 57,608 | 37,045 | 27,762 | 26,685 | 25,473 | 29,184 | 25,697 | 34,650 | 39,146 | 51,997 |
| 2002 | 65,893 | 58,962 | 58,569 | 44,882 | 32,659 | 27,696 | 30,899 | 30,668 | 28,357 | 37,204 | 49,556 | 68,056 |
| 2003 | 80,534 | 70,155 | 52,368 | 35,903 | 31,266 | 25,652 | 24,580 | 26,666 | 27,072 | 34,914 | 46,556 | 64,253 |
| 2004 | 80,680 | 70,341 | 53,056 | 37,842 | 30,840 | 25,006 | 25,592 | 27,498 | 26,658 | 33,102 | 43,630 | 65,054 |
| 2005 | 72,775 | 58,428 | 61,390 | 39,473 | 30,697 | 28,897 | 28,628 | 29,602 | 26,476 | 32,838 | 44,576 | 70,488 |
| 2006 | 56,899 | 57,392 | 54,200 | 34,311 | 30,004 | 26,873 | 29,579 | 29,996 | 27,630 | 39,210 | 47,253 | 56,403 |
| 2007 | 66,914 | 76,347 | 49,045 | 40,498 | 29,129 | 27,272 | 28,150 | 34,503 | 29,267 | 35,013 | 48,878 | 63,510 |
| 2008 | 77,386 | 73,487 | 57,916 | 38,129 | 31,225 | 30,240 | 30,652 | 29,873 | 26,242 | 33,987 | 47,500 | 67,443 |
| 2009 | 80,503 | 62,657 | 46,963 | 32,918 | 26,031 | 24,864 | 24,648 | 27,394 | 27,205 | 37,690 | 41,578 | 67,604 |
| 2010 | 77,087 | 65,696 | 48,952 | 32,846 | 32,393 | 30,978 | 33,593 | 34,197 | 31,733 | 35,899 | 50,018 | 79,380 |
| 2011 | 84,150 | 68,219 | 64,607 | 46,328 | 40,914 | 35,086 | 41,594 | 37,581 | 36,220 | 43,315 | 55,291 | 72,172 |
| 2012 | 82,948 | 73,609 | 57,148 | 45,883 | 45,028 | NA | ||||||
| - = No Data Reported; -- = Not Applicable; NA = Not Available; W = Withheld to avoid disclosure of individual company data. |
| Release Date: 8/31/2012 |
| Next Release Date: 9/28/2012 |