
Census.gov › Data › Data Visualization Gallery › Differential City Growth Patterns, 1950 to 2010
Data
Differential City Growth Patterns, 1950 to 2010
August 2, 2012
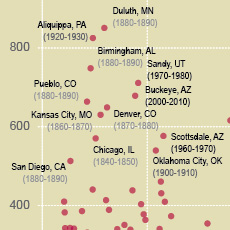
City growth can reflect increases in population, area, or both. Many older, established cities have retained a similar amount of land area since 1950. These cities often border other municipalities and have no free adjacent territory to annex. In contrast, many cities in the South and West are often able to annex territory and population.
*Nashville-Davidson metropolitan government (balance), TN; Indianapolis (balance), IN; Louisville/Jefferson County metropolitan government (balance), KY
Notes: Cities are those of 500,000 or more people in 2010. Within each category, cities are arranged (left to right) from smallest to largest percent change in area between 1950 and 2010. Population and area data are from decennial censuses for 1950, 1960, 1970, 1980, 1990, 2000, and 2010.
Recent Data Visualizations
 I-5 Population Density Profile, 2010
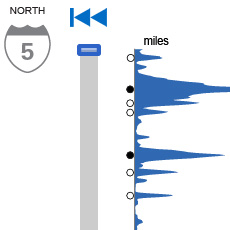 I-5 Population Density Profile, 2010
 Islands of High Income
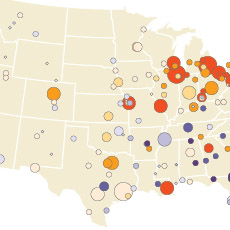 The Great Migration, 1910 to 1970
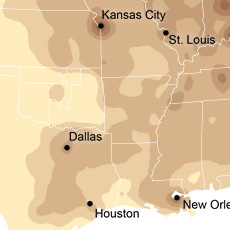 Following the Frontier Line, 1790 to 1890
 Changing Ranks of States by Congressional Representation
 Cartograms of State Populations in 1890, 1950, and 2010
 Before and After 1940: Change in Population Density
 From Physical to Political Geography
 Differential City Growth Patterns
 I-95 Population Density Profile
 Increasing Urbanization
 Gaining and Losing Shares
 Top 20 Cities
 Facebook
 Twitter
 Flickr
 YouTube