
Census.gov › Data › Data Visualization Gallery › I-95 Population Density Profile, 2010
Data
I-95 Population Density Profile, 2010
July 26, 2012
Running from Florida to Maine, I-95 passes through 15 states and several major cities. I-95 serves the most densely populated region of the U.S., the Boston-to-Washington corridor. Peaks and valleys in population density within 5 miles of the interstate show several stretches of continuously built-up area, especially evident from Petersburg, VA to Lewiston, ME. Selected cities along the route are labeled, for reference.
NOTES: Data are from the 2010 Census. The graph is based on average population density within 5 miles of the I-95 route, in 2-mile increments, using 2010 block group centroids.
Recent Data Visualizations
 I-5 Population Density Profile, 2010
 I-5 Population Density Profile, 2010
 Islands of High Income
 The Great Migration, 1910 to 1970
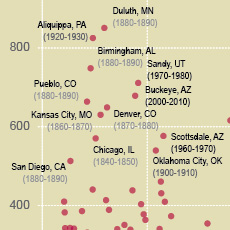
 Following the Frontier Line, 1790 to 1890
 Changing Ranks of States by Congressional Representation
 Cartograms of State Populations in 1890, 1950, and 2010
 Before and After 1940: Change in Population Density
 From Physical to Political Geography
 Differential City Growth Patterns
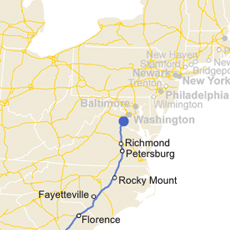 I-95 Population Density Profile
 Increasing Urbanization
 Gaining and Losing Shares
 Top 20 Cities
 Facebook
 Twitter
 Flickr
 YouTube