
Foreign Trade
You are here: Census.gov › Business & Industry ›Foreign Trade › U.S. International Trade Data
U.S. International Trade in Goods and Services Highlights
September 11, 2012
Goods and Services Deficit Increases in July 2012
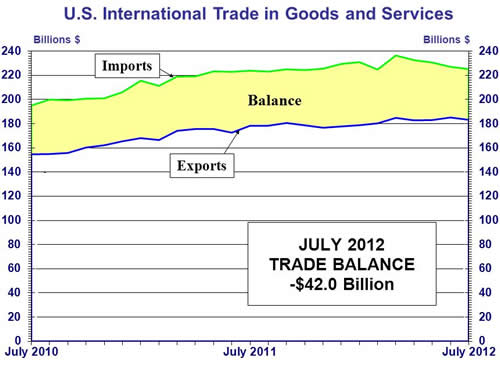
The Nation’s international trade deficit in goods and services increased to $42.0 billion in July from $41.9 billion in June (revised), as exports decreased more than imports.
|
Goods and Services
- Exports decreased to $183.3 billion in July from $185.2 billion in June (revised). Goods were $130.8 billion in July, down from $132.8 in June. Services were $52.5 billion in July, virtually unchanged from June.
- Imports decreased to $225.3 billion in July from $227.1 billion in June (revised). Goods were $188.1 billion in July, down from $190.2 billion in June. Services were $37.2 billion in July, up from $36.9 billion in June.
- For goods, the deficit was $57.3 billion in July, down from $57.4 billion in June (revised). For services, the surplus was $15.3 billion in July, down from $15.5 billion in June.
Goods by Category (Census basis)
- The June to July decrease in exports of goods reflected decreases in industrial supplies and materials ($2.4 billion); automotive vehicles, parts, and engines ($0.6 billion); other goods ($0.6 billion); and consumer goods ($0.4 billion). Increases occurred in foods, feeds, and beverages ($1.8 billion) and capital goods ($0.1 billion).
- The June to July decrease in imports of goods reflected decreases in industrial supplies and materials ($2.1 billion); capital goods ($0.6 billion);andother goods ($0.4 billion). Increases occurred in automotive vehicles, parts, and engines ($0.5 billion); consumer goods ($0.4 billion);and foods, feeds, and beverages ($0.1 billion).
Services by Category
- Exports of services were virtually unchanged from June to July. Increases in royalties and license fees ($0.1 billion), travel ($0.1 billion), and other private services ($0.1 billion), which includes items such as business, professional, and technical services, insurance services, and financial services, were mostly offset by decreases in several categories. The largest decrease was in other transportation ($0.1 billion), which includes freight and port services.
- Imports of services increased $0.3 billion from June to July. The increase was more than accounted for by an increase in royalties and license fees ($0.4 billion), which included payments for the rights to broadcast the 2012 Summer Olympic Games. Decreases in passenger fares ($0.1 billion) and travel ($0.1 billion) were partly offsetting. Changes in the other categories of services imports were small.
Goods by Geographic Area (Not Seasonally Adjusted)
- The goods deficit with Canada increased from $1.5 billion in June to $2.1 billion in July. Exports decreased $3.1 billion (primarily automobiles, parts and accessories; nonmonetary gold; and petroleum products) to $22.7 billion, while imports decreased $2.5 billion (primarily automobiles, parts and accessories) to $24.9 billion.
- The goods deficit with China increased from $27.4 billion in June to $29.4 billion in July. Exports were virtually unchanged at $8.6 billion, while imports increased $2.0 billion (primarily cell phones and other household goods; toys, games, and sporting goods; apparel; and footwear) to $37.9 billion.
- The goods deficit with the European Union increased from $8.4 billion in June to $12.0 billion in July. Exports decreased $2.7 billion (primarily pharmaceutical preparations, fuel oil, and passenger cars) to $20.6 billion, while imports increased $0.8 billion (primarily passenger cars, petroleum products, and gem diamonds) to $32.5 billion.
This and more information is provided in the Bureau of the Census and Bureau of Economic Analysis press release:
U.S.International Trade in Goods and Services: July 2012 .
For further information on goods, contact Maria Iseman, Foreign Trade Division, U.S. Census Bureau, on (301) 763-2311; on services, contact Edward Dozier, U.S. Bureau of Economic Analysis, on (202) 606-9559.
NOTE: Total goods data are reported on a Balance of Payments basis; commodity and country detail data for goods are on a Census basis. For information on data sources and definitions, see the information section on page A-1 of the FT-900 release, or at www.census.gov/ft900 or http://www.bea.gov/bea/di/home/trade.htm.
The next release is October 11, 2012
Note: Total goods data are reported on a Balance of Payments basis; commodity and country detail data for goods are on a Census basis. For information on data sources and definitions, see the Information Section (PDF, 53k) (TXT, 23k)
Related sites:
July 2012
Trade Numbers
Deficit: $42.0 Billion
Exports: $183.3 Billion
Imports: $225.3 Billion
Next release: October 11, 2012
Complete Release Schedule
Export Training Videos
A collection of videos to enhance export trainingUpcoming Seminars and Workshops
October 3, 2012
The Fundamentals of Exporting Webinar Series
The Fundamentals of Exporting Webinar Series
October 16, 2012
Go Global
Chicago, IL
Go Global
Chicago, IL
Contact Us
Contact the Foreign Trade Data Dissemination staff: Email us! or use our feedback form!
Call us: (301)763-2311 or 1-800-549-0595 option 4
[PDF] or  denotes a file in Adobe’s Portable Document Format. To view the file, you will need the Adobe® Reader®
  available free from Adobe.
[Excel] or the letters [xls] indicate a document is in the Microsoft® Excel® Spreadsheet Format (XLS). To view the file, you will need the Microsoft® Excel® Viewer available for free from Microsoft®.
[MSWord] or the letters [doc] indicate a document is in the Microsoft® Word Format (DOC). To view the file, you will need the Microsoft® Word Viewer available for free from Microsoft®.
This symbol indicates a link to a non-government web site. Our linking to these sites does not constitute an endorsement of any products, services or the information found on them. Once you link to another site you are subject to the policies of the new site.
available free from Adobe.
[Excel] or the letters [xls] indicate a document is in the Microsoft® Excel® Spreadsheet Format (XLS). To view the file, you will need the Microsoft® Excel® Viewer available for free from Microsoft®.
[MSWord] or the letters [doc] indicate a document is in the Microsoft® Word Format (DOC). To view the file, you will need the Microsoft® Word Viewer available for free from Microsoft®.
This symbol indicates a link to a non-government web site. Our linking to these sites does not constitute an endorsement of any products, services or the information found on them. Once you link to another site you are subject to the policies of the new site.
 Facebook
 Twitter
 Flickr
 YouTube