October 28, 2011 (The Editor’s Desk is updated each business day.)
State employment and unemployment, September 2011
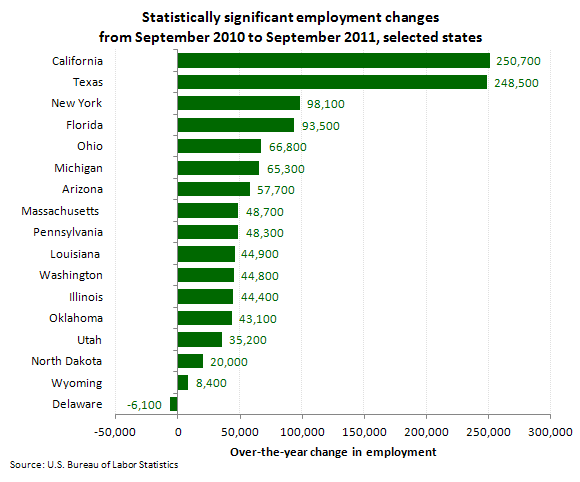
Over the year—from September 2010 to September 2011—28 states experienced statistically significant changes in employment, 27 of which were increases. The largest increase occurred in California (+250,700), followed by Texas (+248,500), New York (+98,100), and Florida (+93,500). The only state with an over-the-year statistically significant decrease in employment was Delaware (−6,100).
[Chart data]
The largest over-the-year percentage increase in employment occurred in North Dakota (+5.3 percent), followed by Utah and Wyoming (+3.0 percent each). The largest over-the-year percentage decrease in employment occurred in Delaware (−1.5 percent).

[Chart data]
Nevada continued to report the highest unemployment rate among the states, 13.4 percent in September. California posted the next highest rate, 11.9 percent. North Dakota registered the lowest jobless rate, 3.5 percent, followed by Nebraska, 4.2 percent.
In total, 26 states reported jobless rates significantly lower than the U.S. figure of 9.1 percent, 10 states and the District of Columbia had measurably higher rates, and 14 states had rates that were not appreciably different from that of the nation.
These data are from the Current Employment Statistics (State and Metro Area) and Local Area Unemployment Statistics programs. Data for the most recent month are preliminary and subject to revision. To learn more, see "Regional and State Employment and Unemployment — September 2011" (HTML) (PDF), news release USDL-11-1503.
Related TED articles
Employment |
Metropolitan areas and counties |
Unemployment
Of interest
Spotlight on Statistics: National Hispanic Heritage Month
In this Spotlight, we take a look at the Hispanic labor force—including labor force participation, employment and unemployment, educational attainment, geographic location, country of birth, earnings, consumer expenditures, time use, workplace injuries, and employment projections.
.
Read more »