March 2, 2012 (The Editor’s Desk is updated each business day.)
Consumer Price Index for the elderly
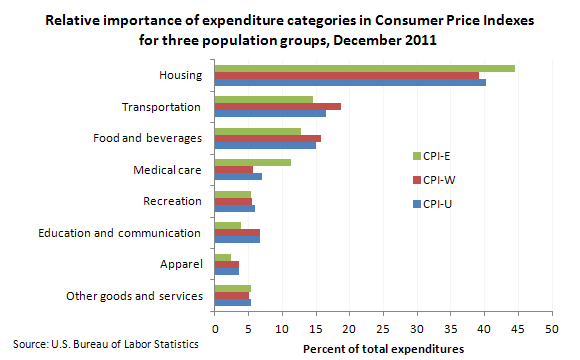
The Bureau of Labor Statistics calculates official price indexes for two population groups. One is the Consumer Price Index for All Urban Consumers (CPI-U), which represents the spending habits of about 88 percent of the population of the United States. The other is the CPI for Urban Wage Earners and Clerical Workers (CPI-W), a subset of the CPI-U population, which represents about 29 percent of the U.S. population. BLS also calculates an experimental CPI for the elderly, or CPI-E, by using households whose reference person or spouse is 62 years of age or older. In 2009–2010, approximately 24 percent of all consumer units met the CPI-E's definition of having a reference person or spouse 62 years of age or older.
[Chart data]
From December 1982 through December 2011, the all-items CPI-E rose at an annual average rate of 3.1 percent, compared with increases of 2.9 percent for both the CPI-U and CPI-W. There are several reasons that older Americans faced slightly higher inflation rates over the past 29 years. First, older Americans devote a substantially larger share of their total budgets to medical care. The share of expenditures on medical care by the CPI-E population is roughly double that of either the CPI-U population or the CPI-W population. In addition, over the 1983–2011 period, medical care inflation increased significantly more than inflation for most other goods and services (5.1 percent annually for medical care, compared with 2.8 percent for all items less medical care). Second, older Americans spend relatively more on shelter, and during the last 29 years shelter costs have modestly outpaced overall inflation.
Although the CPI-E generally outpaced the official measures of inflation over the 1983–2011 timeframe, recent trends show different results. From 2006 to 2011, both the all-items CPI-E and the CPI-U rose at an average annual rate of 2.3 percent, while the CPI-W increased 2.4 percent. This turnaround was caused primarily by changes in the relative inflation rates of medical care and shelter, compared with the overall inflation rate. Specifically, the gap between medical care inflation and overall inflation has generally fallen since 2005, and shelter inflation has been rising slightly more slowly than overall inflation over the 2006–2011 period.
These data are from the Consumer Price Index program. To learn more, see Focus on Prices and Spending, February 2012, volume 2, number 15, "The Experimental Price Index for Older Americans (CPI-E)" (HTML) (PDF).
Related TED articles
Prices |
Retirement
Of interest
Spotlight on Statistics: National Hispanic Heritage Month
In this Spotlight, we take a look at the Hispanic labor force—including labor force participation, employment and unemployment, educational attainment, geographic location, country of birth, earnings, consumer expenditures, time use, workplace injuries, and employment projections.
.
Read more »