Local forecast by
"City, St" |
|
|
 |
|
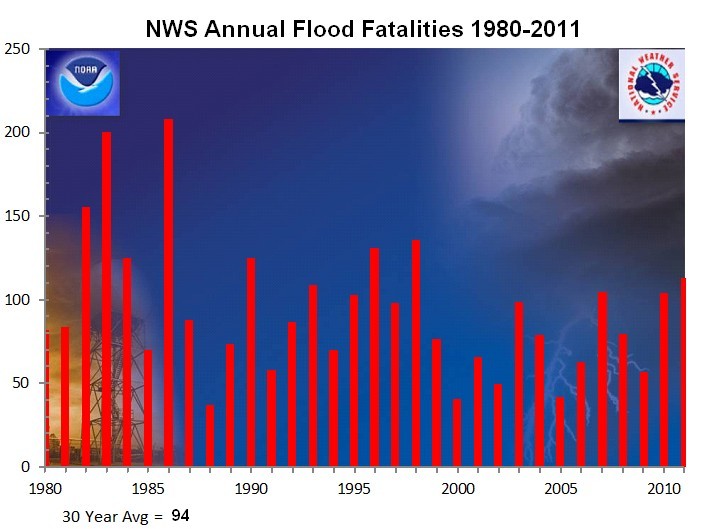
Hydrologic Information Center - NWS Flood Fatality Data
30 Year Average = 94 Fatalities per Year
Fatalities graph
Year |
Annual Total |
Vehicle Related |
Jan |
Feb |
Mar |
Apr |
May |
Jun |
Jul |
Aug |
Sep |
Oct |
Nov |
Dec |
| 2011 |
113 |
68 |
0 |
6 |
4 |
17 |
|
5 |
10 |
29 |
18 |
0 |
9 |
0 |
| 2010 |
104 |
50 |
3 |
1 |
2 |
|
36 |
25 |
12 |
5 |
13 |
2 |
0 |
2 |
| 2009 |
56 |
45 |
4 |
- |
4 |
8 |
9 |
3 |
1 |
1 |
14 |
8 |
1 |
3 |
| 2008 |
80 |
46 |
4 |
3 |
15 |
10 |
1 |
11 |
10 |
7 |
18 |
1 |
- |
- |
| 2007 |
105 |
67 |
9 |
- |
12 |
6 |
18 |
16 |
11 |
26 |
3 |
- |
- |
4 |
| 2006 |
63 |
32 |
- |
- |
12 |
2 |
8 |
21 |
5 |
3 |
3 |
4 |
2 |
3 |
| 2005 |
42* |
20 |
12 |
2 |
3 |
4 |
1 |
4 |
8 |
7* |
10* |
10 |
- |
3 |
| 2004 |
79 |
51 |
3 |
2 |
3 |
9 |
13 |
2 |
5 |
9 |
25 |
2 |
3 |
3 |
| 2003 |
99 |
47 |
- |
7 |
- |
8 |
14 |
14 |
9 |
14 |
1 |
3 |
12 |
17 |
| 2002 |
50 |
31 |
7 |
- |
4 |
2 |
15 |
- |
10 |
2 |
1 |
3 |
1 |
5 |
| 2001 |
66 |
31 |
- |
5 |
3 |
1 |
6 |
21 |
12 |
7 |
- |
- |
9 |
2 |
| 2000 |
41 |
20 |
- |
5 |
2 |
- |
- |
6 |
3 |
6 |
4 |
9 |
4 |
2 |
| 1999 |
77 |
40 |
12 |
- |
- |
7 |
2 |
7 |
6 |
2 |
38 |
3 |
- |
- |
| 1998 |
136 |
86 |
18 |
10 |
16 |
6 |
3 |
16 |
8 |
16 |
3 |
38 |
2 |
- |
| 1997 |
98 |
|
|
|
|
|
|
|
|
|
|
3 |
4 |
2 |
| Years previous to 1997 only show annual totals |
|

Several documents on this page are in PDF format. Click on the icon to download a free Adobe Acrobat Reader
|

