|
Download Data (XLS File) |
|
||||||||
|
||||||||
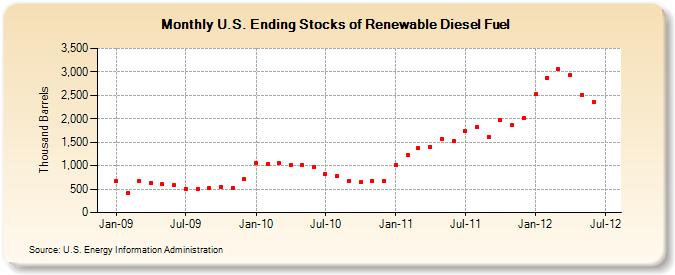
| U.S. Ending Stocks of Renewable Diesel Fuel (Thousand Barrels) | ||||||||
| Year | Jan | Feb | Mar | Apr | May | Jun | Jul | Aug | Sep | Oct | Nov | Dec |
|---|---|---|---|---|---|---|---|---|---|---|---|---|
| 2009 | 664 | 424 | 665 | 632 | 600 | 581 | 511 | 511 | 527 | 553 | 531 | 711 |
| 2010 | 1,049 | 1,039 | 1,057 | 1,009 | 1,016 | 968 | 830 | 771 | 682 | 650 | 676 | 672 |
| 2011 | 1,016 | 1,217 | 1,381 | 1,408 | 1,576 | 1,524 | 1,748 | 1,834 | 1,617 | 1,965 | 1,877 | 2,012 |
| 2012 | 2,527 | 2,869 | 3,053 | 2,932 | 2,514 | 2,363 | ||||||
| - = No Data Reported; -- = Not Applicable; NA = Not Available; W = Withheld to avoid disclosure of individual company data. |
| Release Date: 8/30/2012 |
| Next Release Date: Last Week of September 2012 |