|
Download Data (XLS File) |
|
||||||||
|
||||||||
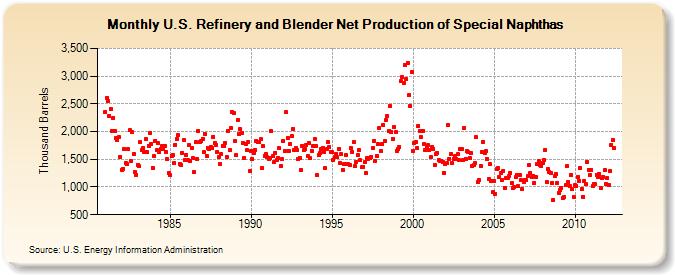
| U.S. Refinery and Blender Net Production of Special Naphthas (Thousand Barrels) | ||||||||
| Year | Jan | Feb | Mar | Apr | May | Jun | Jul | Aug | Sep | Oct | Nov | Dec |
|---|---|---|---|---|---|---|---|---|---|---|---|---|
| 1981 | 2,353 | 2,612 | 2,554 | 2,285 | 2,411 | 2,017 | 2,248 | 2,002 | 1,878 | 1,848 | 1,894 | 1,550 |
| 1982 | 1,315 | 1,331 | 1,694 | 1,439 | 1,409 | 1,677 | 2,022 | 1,462 | 1,987 | 1,601 | 1,266 | 1,225 |
| 1983 | 1,399 | 1,373 | 1,805 | 1,659 | 1,698 | 1,630 | 1,859 | 1,624 | 1,748 | 1,965 | 1,782 | 1,351 |
| 1984 | 1,552 | 1,838 | 1,659 | 1,787 | 1,631 | 1,690 | 1,742 | 1,683 | 1,734 | 1,632 | 1,500 | 1,256 |
| 1985 | 1,212 | 1,566 | 1,569 | 1,429 | 1,765 | 1,873 | 1,934 | 1,416 | 1,405 | 1,618 | 1,853 | 1,489 |
| 1986 | 1,584 | 1,481 | 1,754 | 1,462 | 1,705 | 1,516 | 1,269 | 1,807 | 1,513 | 2,007 | 1,820 | 1,827 |
| 1987 | 1,866 | 1,627 | 1,959 | 1,565 | 1,704 | 1,682 | 1,725 | 1,705 | 1,909 | 1,792 | 1,766 | 1,636 |
| 1988 | 1,538 | 1,413 | 1,596 | 1,745 | 1,732 | 1,795 | 1,537 | 2,013 | 1,659 | 2,059 | 2,351 | 2,335 |
| 1989 | 1,824 | 1,571 | 2,212 | 1,949 | 2,040 | 1,973 | 1,794 | 1,521 | 1,769 | 1,660 | 1,818 | 1,287 |
| 1990 | 1,655 | 1,507 | 1,609 | 1,670 | 1,835 | 1,808 | 1,814 | 1,859 | 1,351 | 1,738 | 1,567 | 1,593 |
| 1991 | 1,536 | 1,510 | 1,528 | 2,002 | 1,551 | 1,442 | 1,621 | 1,493 | 1,531 | 1,697 | 1,386 | 1,500 |
| 1992 | 1,828 | 1,653 | 2,347 | 1,884 | 1,654 | 1,776 | 1,919 | 2,047 | 1,673 | 1,712 | 1,667 | 1,503 |
| 1993 | 1,524 | 1,304 | 1,747 | 1,661 | 1,686 | 1,760 | 1,561 | 1,794 | 1,520 | 1,654 | 1,747 | 1,869 |
| 1994 | 1,740 | 1,210 | 1,576 | 1,613 | 1,690 | 1,709 | 1,626 | 1,342 | 1,690 | 1,813 | 1,717 | 1,633 |
| 1995 | 1,629 | 1,490 | 1,533 | 1,604 | 1,536 | 1,692 | 1,434 | 1,590 | 1,310 | 1,409 | 1,570 | 1,416 |
| 1996 | 1,412 | 1,395 | 1,701 | 1,628 | 1,812 | 1,370 | 1,453 | 1,574 | 1,662 | 1,478 | 1,355 | 1,366 |
| 1997 | 1,445 | 1,249 | 1,527 | 1,506 | 1,526 | 1,547 | 1,700 | 1,834 | 1,469 | 1,560 | 1,768 | 2,060 |
| 1998 | 1,651 | 1,775 | 2,126 | 1,821 | 2,211 | 2,280 | 2,006 | 2,460 | 1,995 | 1,866 | 2,083 | 1,989 |
| 1999 | 1,653 | 1,682 | 1,719 | 2,909 | 2,984 | 2,876 | 3,208 | 2,942 | 3,243 | 2,651 | 2,462 | 3,067 |
| 2000 | 1,646 | 1,802 | 1,810 | 1,697 | 2,103 | 2,011 | 1,893 | 2,006 | 1,773 | 1,664 | 1,713 | 1,750 |
| 2001 | 1,660 | 1,532 | 1,715 | 1,692 | 1,397 | 1,592 | 1,618 | 1,480 | 1,475 | 1,471 | 1,445 | 1,257 |
| 2002 | 1,411 | 1,431 | 2,115 | 1,512 | 1,592 | 1,434 | 1,505 | 1,553 | 1,507 | 1,587 | 1,479 | 1,686 |
| 2003 | 1,681 | 1,483 | 2,073 | 1,511 | 1,645 | 1,627 | 1,524 | 1,606 | 1,374 | 1,388 | 1,424 | 1,895 |
| 2004 | 1,099 | 1,122 | 1,386 | 1,638 | 1,814 | 1,607 | 1,644 | 1,505 | 1,143 | 1,406 | 1,108 | 905 |
| 2005 | 1,107 | 880 | 1,329 | 1,340 | 1,181 | 1,248 | 1,129 | 1,297 | 977 | 1,163 | 1,166 | 1,192 |
| 2006 | 1,259 | 1,066 | 979 | 996 | 1,177 | 1,210 | 1,017 | 1,219 | 1,130 | 955 | 1,092 | 1,130 |
| 2007 | 1,118 | 1,196 | 1,400 | 1,250 | 1,172 | 1,203 | 1,076 | 1,173 | 1,422 | 1,460 | 1,388 | 1,378 |
| 2008 | 1,438 | 1,478 | 1,671 | 1,089 | 1,320 | 1,277 | 1,245 | 1,074 | 766 | 1,193 | 1,231 | 1,078 |
| 2009 | 896 | 949 | 986 | 804 | 821 | 1,029 | 1,370 | 1,087 | 1,019 | 1,214 | 963 | 821 |
| 2010 | 1,040 | 1,018 | 1,182 | 1,110 | 1,345 | 965 | 825 | 1,104 | 1,045 | 1,458 | 1,309 | 1,223 |
| 2011 | 1,313 | 1,016 | 1,059 | 1,046 | 1,222 | 1,188 | 1,232 | 973 | 1,160 | 1,189 | 1,305 | 1,057 |
| 2012 | 1,162 | 1,029 | 1,288 | 1,762 | 1,856 | 1,702 | ||||||
| - = No Data Reported; -- = Not Applicable; NA = Not Available; W = Withheld to avoid disclosure of individual company data. |
| Release Date: 8/30/2012 |
| Next Release Date: Last Week of September 2012 |