|
Download Data (XLS File) |
|
||||||||
|
||||||||
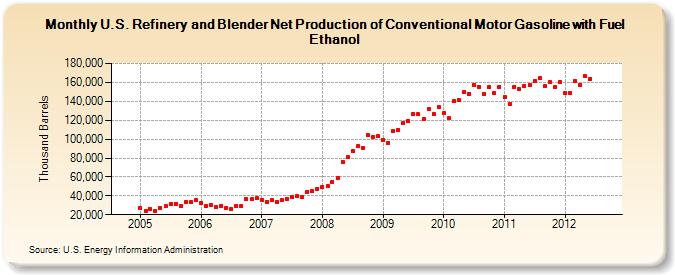
| U.S. Refinery and Blender Net Production of Conventional Motor Gasoline with Fuel Ethanol (Thousand Barrels) | ||||||||
| Year | Jan | Feb | Mar | Apr | May | Jun | Jul | Aug | Sep | Oct | Nov | Dec |
|---|---|---|---|---|---|---|---|---|---|---|---|---|
| 2005 | 26,610 | 24,436 | 25,974 | 23,945 | 27,301 | 28,799 | 31,459 | 31,267 | 29,435 | 33,219 | 33,192 | 35,079 |
| 2006 | 32,431 | 29,343 | 30,349 | 28,325 | 29,666 | 27,416 | 25,541 | 29,273 | 29,252 | 36,378 | 36,180 | 37,457 |
| 2007 | 35,939 | 33,647 | 35,594 | 33,190 | 36,084 | 37,018 | 38,363 | 39,283 | 38,672 | 44,395 | 44,841 | 47,043 |
| 2008 | 49,429 | 50,631 | 54,907 | 58,756 | 75,670 | 81,367 | 87,617 | 92,222 | 90,448 | 104,039 | 102,335 | 102,947 |
| 2009 | 99,569 | 96,107 | 108,213 | 110,095 | 116,874 | 119,659 | 126,702 | 126,248 | 121,548 | 131,936 | 126,631 | 134,201 |
| 2010 | 127,503 | 122,032 | 139,952 | 140,880 | 149,550 | 148,156 | 157,131 | 155,268 | 147,794 | 155,060 | 148,349 | 155,595 |
| 2011 | 144,168 | 137,029 | 155,447 | 152,630 | 156,606 | 157,437 | 161,833 | 164,169 | 155,681 | 159,938 | 154,871 | 160,500 |
| 2012 | 148,742 | 148,614 | 161,715 | 157,254 | 166,397 | 164,099 | ||||||
| - = No Data Reported; -- = Not Applicable; NA = Not Available; W = Withheld to avoid disclosure of individual company data. |
| Release Date: 8/30/2012 |
| Next Release Date: Last Week of September 2012 |