|
Download Data (XLS File) |
|
||||||||||
|
||||||||||
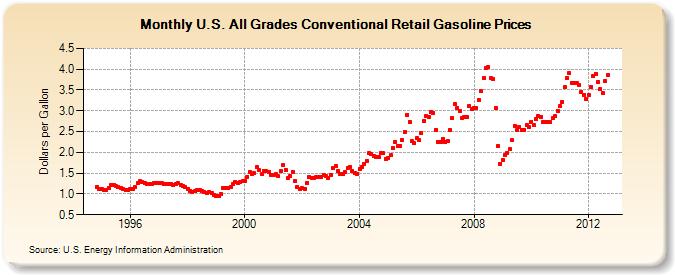
| U.S. All Grades Conventional Retail Gasoline Prices (Dollars per Gallon) | ||||||||||
| Year | Jan | Feb | Mar | Apr | May | Jun | Jul | Aug | Sep | Oct | Nov | Dec |
|---|---|---|---|---|---|---|---|---|---|---|---|---|
| 1994 | 1.175 | 1.112 | ||||||||||
| 1995 | 1.107 | 1.099 | 1.099 | 1.143 | 1.213 | 1.226 | 1.189 | 1.161 | 1.148 | 1.122 | 1.098 | 1.105 |
| 1996 | 1.123 | 1.121 | 1.169 | 1.259 | 1.302 | 1.282 | 1.254 | 1.238 | 1.238 | 1.243 | 1.273 | 1.273 |
| 1997 | 1.270 | 1.263 | 1.237 | 1.228 | 1.229 | 1.227 | 1.206 | 1.250 | 1.254 | 1.222 | 1.198 | 1.159 |
| 1998 | 1.115 | 1.082 | 1.055 | 1.064 | 1.088 | 1.086 | 1.078 | 1.049 | 1.033 | 1.045 | 1.020 | 0.964 |
| 1999 | 0.957 | 0.940 | 1.000 | 1.137 | 1.143 | 1.134 | 1.177 | 1.237 | 1.279 | 1.271 | 1.280 | 1.302 |
| 2000 | 1.319 | 1.409 | 1.538 | 1.476 | 1.496 | 1.645 | 1.568 | 1.480 | 1.562 | 1.546 | 1.533 | 1.458 |
| 2001 | 1.467 | 1.471 | 1.423 | 1.557 | 1.689 | 1.586 | 1.381 | 1.422 | 1.539 | 1.312 | 1.177 | 1.111 |
| 2002 | 1.134 | 1.129 | 1.259 | 1.402 | 1.394 | 1.380 | 1.402 | 1.398 | 1.403 | 1.466 | 1.424 | 1.389 |
| 2003 | 1.464 | 1.622 | 1.675 | 1.557 | 1.477 | 1.489 | 1.519 | 1.625 | 1.654 | 1.551 | 1.512 | 1.488 |
| 2004 | 1.595 | 1.654 | 1.728 | 1.794 | 1.981 | 1.950 | 1.902 | 1.880 | 1.880 | 1.993 | 1.973 | 1.843 |
| 2005 | 1.852 | 1.927 | 2.102 | 2.251 | 2.155 | 2.162 | 2.287 | 2.489 | 2.907 | 2.736 | 2.265 | 2.216 |
| 2006 | 2.343 | 2.293 | 2.454 | 2.762 | 2.873 | 2.849 | 2.964 | 2.952 | 2.548 | 2.258 | 2.254 | 2.328 |
| 2007 | 2.237 | 2.276 | 2.546 | 2.831 | 3.157 | 3.067 | 2.989 | 2.821 | 2.858 | 2.838 | 3.110 | 3.032 |
| 2008 | 3.068 | 3.064 | 3.263 | 3.468 | 3.783 | 4.038 | 4.051 | 3.789 | 3.760 | 3.065 | 2.153 | 1.721 |
| 2009 | 1.821 | 1.942 | 1.987 | 2.071 | 2.289 | 2.645 | 2.530 | 2.613 | 2.530 | 2.549 | 2.665 | 2.620 |
| 2010 | 2.730 | 2.657 | 2.793 | 2.867 | 2.847 | 2.733 | 2.728 | 2.733 | 2.727 | 2.816 | 2.866 | 3.004 |
| 2011 | 3.109 | 3.219 | 3.561 | 3.796 | 3.900 | 3.678 | 3.665 | 3.664 | 3.624 | 3.454 | 3.385 | 3.277 |
| 2012 | 3.388 | 3.576 | 3.827 | 3.893 | 3.698 | 3.515 | 3.433 | 3.724 | 3.859 | |||
| - = No Data Reported; -- = Not Applicable; NA = Not Available; W = Withheld to avoid disclosure of individual company data. |
| Release Date: 9/24/2012 |
| Next Release Date: 10/1/2012 |