|
Download Data (XLS File) |
|
||||||||
|
||||||||
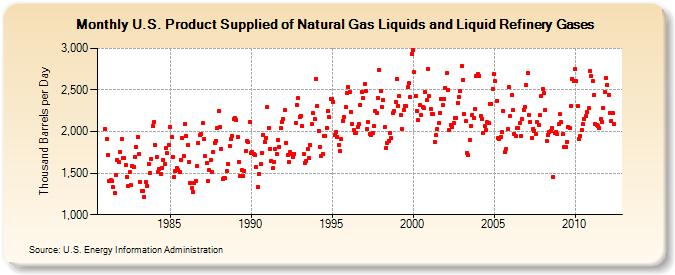
| U.S. Product Supplied of Natural Gas Liquids and Liquid Refinery Gases (Thousand Barrels per Day) | ||||||||
| Year | Jan | Feb | Mar | Apr | May | Jun | Jul | Aug | Sep | Oct | Nov | Dec |
|---|---|---|---|---|---|---|---|---|---|---|---|---|
| 1981 | 2,035 | 1,912 | 1,723 | 1,409 | 1,417 | 1,403 | 1,329 | 1,263 | 1,475 | 1,657 | 1,630 | 1,753 |
| 1982 | 1,912 | 1,687 | 1,681 | 1,594 | 1,452 | 1,343 | 1,509 | 1,353 | 1,589 | 1,576 | 1,692 | 1,812 |
| 1983 | 1,940 | 1,731 | 1,399 | 1,285 | 1,290 | 1,218 | 1,396 | 1,350 | 1,609 | 1,498 | 1,672 | 2,064 |
| 1984 | 2,112 | 1,844 | 1,696 | 1,516 | 1,549 | 1,494 | 1,562 | 1,661 | 1,604 | 1,797 | 1,737 | 1,840 |
| 1985 | 2,055 | 1,931 | 1,700 | 1,458 | 1,522 | 1,564 | 1,537 | 1,512 | 1,662 | 1,923 | 1,709 | 2,088 |
| 1986 | 1,948 | 1,834 | 1,638 | 1,383 | 1,320 | 1,271 | 1,382 | 1,402 | 1,581 | 1,864 | 1,958 | 1,972 |
| 1987 | 2,097 | 1,908 | 1,701 | 1,619 | 1,408 | 1,537 | 1,661 | 1,513 | 1,754 | 1,866 | 1,890 | 2,047 |
| 1988 | 2,244 | 2,052 | 1,796 | 1,433 | 1,441 | 1,436 | 1,523 | 1,605 | 1,824 | 1,907 | 1,946 | 2,149 |
| 1989 | 2,157 | 2,144 | 1,935 | 1,636 | 1,466 | 1,533 | 1,462 | 1,527 | 1,764 | 1,892 | 1,870 | 2,115 |
| 1990 | 1,743 | 1,752 | 1,727 | 1,716 | 1,574 | 1,339 | 1,493 | 1,607 | 1,743 | 1,960 | 1,875 | 1,926 |
| 1991 | 2,295 | 2,045 | 1,795 | 1,643 | 1,556 | 1,637 | 1,790 | 1,728 | 1,900 | 1,820 | 2,037 | 2,119 |
| 1992 | 2,150 | 2,255 | 1,867 | 1,718 | 1,631 | 1,756 | 1,732 | 1,691 | 1,736 | 2,107 | 2,321 | 2,400 |
| 1993 | 2,178 | 2,185 | 2,061 | 1,732 | 1,621 | 1,646 | 1,791 | 1,680 | 1,836 | 2,085 | 2,219 | 2,155 |
| 1994 | 2,637 | 2,311 | 2,011 | 1,820 | 1,706 | 1,736 | 1,948 | 1,952 | 2,043 | 2,246 | 2,169 | 2,393 |
| 1995 | 2,397 | 2,361 | 1,959 | 1,996 | 1,936 | 1,843 | 1,762 | 1,909 | 2,131 | 2,171 | 2,295 | 2,458 |
| 1996 | 2,536 | 2,473 | 2,233 | 2,094 | 2,014 | 1,986 | 1,980 | 2,060 | 2,087 | 2,321 | 2,481 | 2,404 |
| 1997 | 2,574 | 2,488 | 2,034 | 2,113 | 1,968 | 1,957 | 1,983 | 2,071 | 2,246 | 2,228 | 2,409 | 2,742 |
| 1998 | 2,492 | 2,297 | 2,382 | 2,060 | 1,803 | 1,867 | 1,891 | 1,986 | 1,920 | 2,221 | 2,245 | 2,356 |
| 1999 | 2,630 | 2,308 | 2,427 | 2,197 | 2,036 | 2,254 | 2,306 | 2,306 | 2,530 | 2,583 | 2,411 | 2,931 |
| 2000 | 2,982 | 2,713 | 2,425 | 2,253 | 2,137 | 2,315 | 2,200 | 2,295 | 2,285 | 2,472 | 2,374 | 2,755 |
| 2001 | 2,424 | 2,271 | 2,212 | 2,206 | 1,877 | 1,956 | 2,028 | 2,100 | 2,228 | 2,392 | 2,318 | 2,396 |
| 2002 | 2,528 | 2,703 | 2,500 | 2,015 | 2,078 | 2,057 | 2,104 | 2,168 | 2,165 | 2,348 | 2,416 | 2,483 |
| 2003 | 2,790 | 2,622 | 2,211 | 2,126 | 1,747 | 1,713 | 1,903 | 2,072 | 2,204 | 2,164 | 2,268 | 2,662 |
| 2004 | 2,695 | 2,668 | 2,188 | 2,155 | 1,986 | 2,063 | 2,024 | 2,109 | 2,106 | 2,336 | 2,334 | 2,516 |
| 2005 | 2,687 | 2,603 | 2,372 | 1,917 | 1,906 | 1,938 | 2,000 | 2,243 | 1,749 | 1,792 | 2,027 | 2,532 |
| 2006 | 2,185 | 2,440 | 2,256 | 1,971 | 1,949 | 2,039 | 2,044 | 2,098 | 1,952 | 2,150 | 2,264 | 2,298 |
| 2007 | 2,559 | 2,710 | 2,195 | 2,120 | 1,923 | 2,034 | 2,011 | 1,973 | 2,111 | 2,073 | 2,197 | 2,429 |
| 2008 | 2,515 | 2,466 | 2,261 | 1,884 | 1,963 | 1,999 | 2,003 | 2,042 | 1,453 | 1,979 | 1,999 | 1,967 |
| 2009 | 2,090 | 2,207 | 2,109 | 1,969 | 1,817 | 1,811 | 1,878 | 2,058 | 2,037 | 2,309 | 2,637 | 2,606 |
| 2010 | 2,750 | 2,607 | 2,305 | 1,910 | 1,947 | 2,022 | 2,086 | 2,150 | 2,183 | 2,233 | 2,278 | 2,724 |
| 2011 | 2,665 | 2,606 | 2,435 | 2,091 | 2,084 | 2,062 | 2,044 | 2,151 | 2,116 | 2,285 | 2,477 | 2,647 |
| 2012 | 2,565 | 2,445 | 2,229 | 2,127 | 2,220 | 2,088 | ||||||
| - = No Data Reported; -- = Not Applicable; NA = Not Available; W = Withheld to avoid disclosure of individual company data. |
| Release Date: 8/30/2012 |
| Next Release Date: Last Week of September 2012 |