
Census.gov › Data › Data Visualization Gallery › From Physical to Political Geography
Data
From Physical to Political Geography
Descriptions of Population Distribution in Census Publications: 1800, 1900, and 2000
August 9, 2012
Early in the country’s history, descriptions of population distribution across the landscape were tied closely to physical features such as mountains and rivers. Once the extent of generally settled area was established, descriptions tended to focus on gains, losses, and movement of people within and between specific territories, states, or places. By the 20th century, a broader view of population distribution on a national scale is reflected by the increased use of terms such as suburban, rural, metropolitan, and counties. These wordclouds offer an interesting summary of some of the key words in the original material.
SOURCE: Census atlases from 1900 and 2000.
NOTE: Descriptions of population distribution for 1800 and 1900 were taken from the Census Bureau’s 1900 Statistical Atlas of the United States. The atlas includes descriptions of important changes in population distribution between each decade, starting with the first Federal census in 1790. The introduction to the second chapter “Population Distribution” in the Census Atlas of the United States (Census Bureau, 2007) provided the basis for the 2000 wordcloud. The text was edited considerably to combine similar words and eliminate commonly used words.
Recent Data Visualizations
 I-5 Population Density Profile, 2010
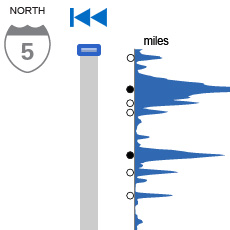 I-5 Population Density Profile, 2010
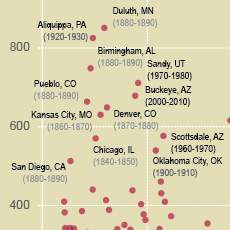
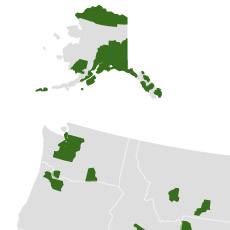 Islands of High Income
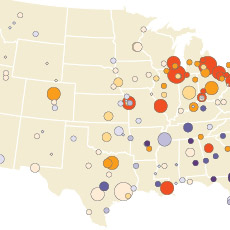 The Great Migration, 1910 to 1970
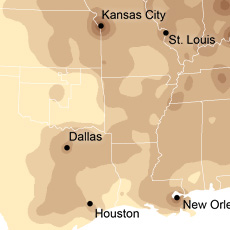 Following the Frontier Line, 1790 to 1890
 Changing Ranks of States by Congressional Representation
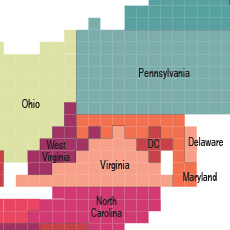 Cartograms of State Populations in 1890, 1950, and 2010
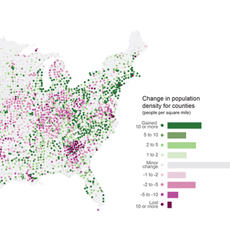 Before and After 1940: Change in Population Density
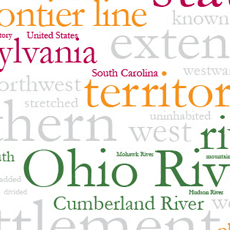 From Physical to Political Geography
 Differential City Growth Patterns
 I-95 Population Density Profile
 Increasing Urbanization
 Gaining and Losing Shares
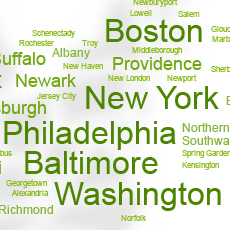 Top 20 Cities
 Facebook
 Twitter
 Flickr
 YouTube