
Census.gov › Data › Data Visualization Gallery › Gaining and Losing Shares
Data
Gaining and Losing Shares
Population Distribution by Region, 1790 to 2010
July 19, 2012The Northeast and South each held about half of the U.S. population in 1790. As the Midwest opened to settlement, it gained an increasingly large share of the population due to migration from the Northeast and South, as well as international migration. By 1890, the Midwest held its largest share of the population. The 20th century saw continued declines in the shares of the population living in the Northeast and Midwest alongside gains in the South and West.
See Census Regions and Divisions of the United States for a map of Census regions. Data for territories are included in the regional totals. Data do not include “Indians not taxed” prior to 1900.
Recent Data Visualizations
 I-5 Population Density Profile, 2010
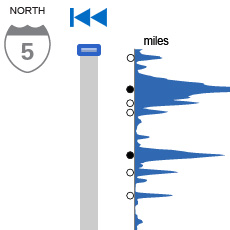 I-5 Population Density Profile, 2010
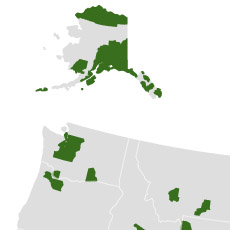 Islands of High Income
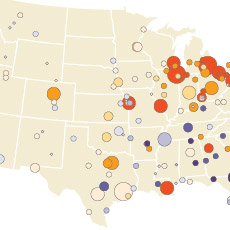 The Great Migration, 1910 to 1970
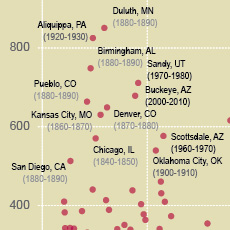
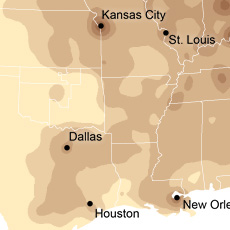 Following the Frontier Line, 1790 to 1890
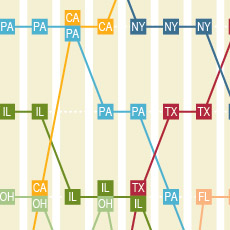 Changing Ranks of States by Congressional Representation
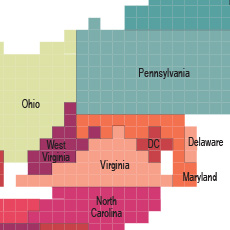 Cartograms of State Populations in 1890, 1950, and 2010
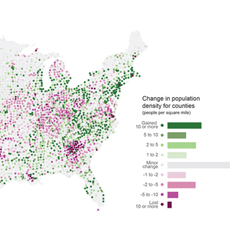 Before and After 1940: Change in Population Density
 From Physical to Political Geography
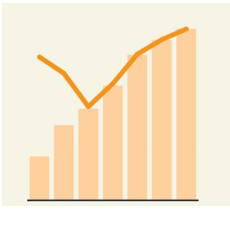 Differential City Growth Patterns
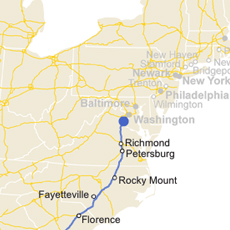 I-95 Population Density Profile
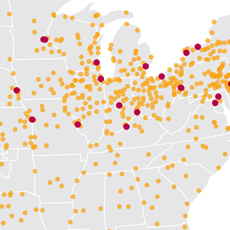 Increasing Urbanization
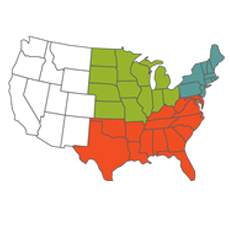 Gaining and Losing Shares
 Top 20 Cities
 Facebook
 Twitter
 Flickr
 YouTube