
Census.gov › Data › Data Visualization Gallery › Changing Ranks of States by Congressional Representation
Data
Changing Ranks of States by Congressional Representation
August 30, 2012


The number of representatives given to each state as a result of apportionment has shifted over time. Shifts in political representation are due to changes in state population relative to other states, the admission of new states to the union, and increases to the total number of memberships in the U.S. House of Representatives instituted by Congress over the decades. The seven states with the largest number of representatives in a given year are included in the graph, beginning with the Continental Congress in 1789 (prior to the first decennial census) and following each decennial census from 1790 through 2010.
SOURCE: Census 2000 published volumes and the 2010 Census
NOTE: Non-voting representatives were not included in calculations to determine rank.
Recent Data Visualizations
 I-5 Population Density Profile, 2010
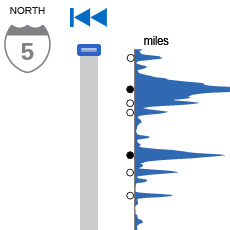 I-5 Population Density Profile, 2010
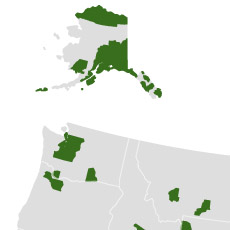 Islands of High Income
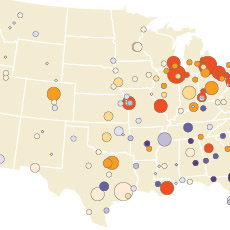 The Great Migration, 1910 to 1970
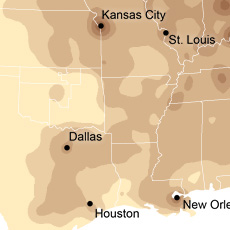 Following the Frontier Line, 1790 to 1890
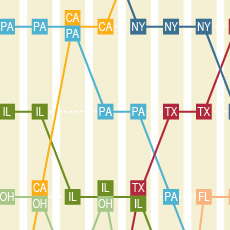 Changing Ranks of States by Congressional Representation
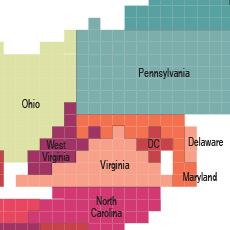 Cartograms of State Populations in 1890, 1950, and 2010
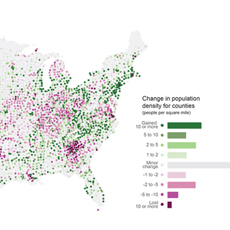 Before and After 1940: Change in Population Density
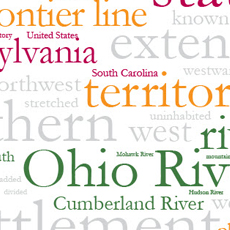 From Physical to Political Geography
 Differential City Growth Patterns
 I-95 Population Density Profile
 Increasing Urbanization
 Gaining and Losing Shares
 Top 20 Cities
 Facebook
 Twitter
 Flickr
 YouTube