
Census.gov › Data › Data Visualization Gallery › Increasing Urbanization
Data
Increasing Urbanization
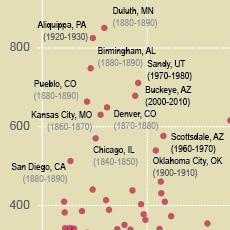
Population Distribution by City Size, 1790 to 1890
July 19, 2012The number and size of cities increased dramatically between 1790 and 1890 as the country's population grew and became increasingly urban. By 1890, people living in cities of 100,000 or more made up a larger proportion of all urban dwellers. This reflected a shift from a rural, agrarian society to one focused on industrial production, especially in the Northeast and around the Great Lakes.
NOTES:
The percentage of the U.S. population living in a city of 2,500 or more was 5.1 in 1790 and rose to 35.1 by 1890. Geography reflects boundaries in place at the time of each census.
The Census Bureau officially adopted 2,500 as the minimum population threshold for urban areas in 1910; prior to that population thresholds of 4,000 and 8,000 were used in Census Bureau reports.
Recent Data Visualizations
 I-5 Population Density Profile, 2010
 I-5 Population Density Profile, 2010
 Islands of High Income
 The Great Migration, 1910 to 1970
 Following the Frontier Line, 1790 to 1890
 Changing Ranks of States by Congressional Representation
 Cartograms of State Populations in 1890, 1950, and 2010
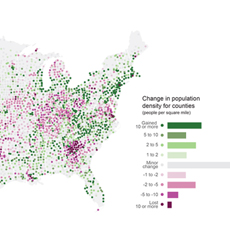 Before and After 1940: Change in Population Density
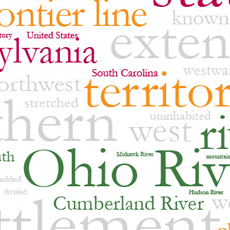 From Physical to Political Geography
 Differential City Growth Patterns
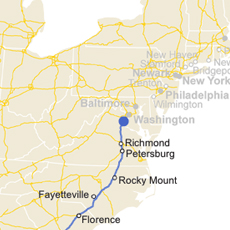 I-95 Population Density Profile
 Increasing Urbanization
 Gaining and Losing Shares
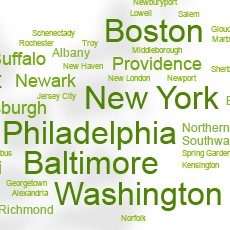 Top 20 Cities
 Facebook
 Twitter
 Flickr
 YouTube