News Release Information
12-1953-BOS
Thursday, September 26, 2012
Contacts
Technical information:
- (617) 565-2327
- BLSInfoBoston@bls.gov
- www.bls.gov/ro1
Media contact:
- (617) 565-2326
- Consedine.Tim@bls.gov
Average Energy Prices in Boston-Brockton-Nashua –
August 2012
Boston area consumers paid 10.1 percent less than the U.S. city average for utility (piped) gas in August, as measured by the Consumer Price Index (CPI), the U.S. Bureau of Labor Statistics reported today. In contrast, electricity prices were 9.0 percent higher in Boston than nationwide. Deborah A. Brown, the Bureau’s regional commissioner, noted that local prices for gasoline were close to the U.S. average. (See table A. Data in this release are not seasonally adjusted; accordingly, over-the-year analysis is used throughout.)
| Energy product | August 2011 | August 2012 | ||||
|---|---|---|---|---|---|---|
| United States | Boston area | Percent difference | United States | Boston area | Percent difference | |
Utility (piped) gas (per therm) |
$1.079 | $1.056 | -2.1 | $0.960 | $0.863 | -10.1 |
Electricity (per KWH) |
0.135 | 0.148 | 9.6 | 0.133 | 0.145 | 9.0 | Gasoline (per gallon) |
3.680 | 3.727 | 1.3 | 3.759 | 3.734 | -0.7 |
|
NOTE: A positive percent difference measures how much the price in the Boston area is above the national price, while a negative difference reflects a lower price in the Boston area. |
||||||
A therm—a measure of constant heating value—of utility (piped) gas, commonly referred to as natural gas, in the Boston area averaged $0.863 in August 2012, a decrease of 18.3 percent from the previous year. Nationwide, a therm averaged $0.960 in August 2012, down 11.0 percent over the year. Local natural gas prices are more subject to seasonal price fluctuations, compared with the nation. (See chart 1.)

A kilowatt-hour (kWh) of electricity cost Boston area consumers $0.145 in August 2012, 2.0 percent less than a year earlier. Nationwide, electricity prices averaged $0.133 in August 2012, 1.5 percent less than a year ago. Over the last five years, the price of electricity in Boston has always exceeded that for the nation, peaking at a differential of 47.2 percent in November 2008. Since then the gap has narrowed considerably, remaining under 25.0 percent since March 2010. (See chart 2.)

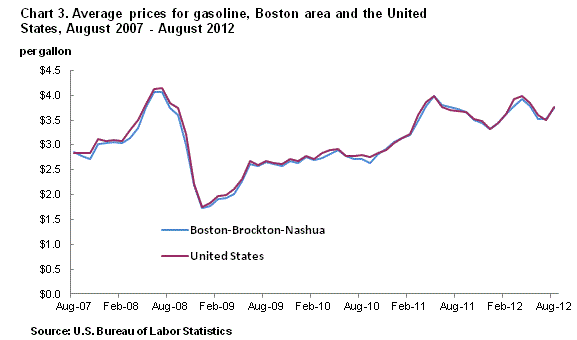
In August 2012, a gallon of gasoline averaged $3.734 in the Boston area, just below the national average of $3.759. Over the year, prices in Boston were nearly unchanged, rising 0.2 percent, compared with the nationwide increase of 2.1 percent. Although gasoline prices can be volatile from month to month, national and local prices have moved in tandem over the last five years. (See chart 3.)
The Boston-Brockton-Nashua, Mass.-N.H.-Maine-Conn. consolidated area covered in this release is comprised of Essex, Middlesex, Norfolk, Plymouth and Suffolk Counties and parts of Bristol, Hampden, and Worcester Counties in Massachusetts; parts of Hillsborough, Merrimack, Rockingham, and Strafford Counties in New Hampshire; part of York County in Maine; and part of Windham County in Connecticut.
Additional Information
Information in this release will be made available to sensory impaired individuals upon request. Voice phone: 202-691-5200; TDD message referral phone number: 1-800-877-8339.
For personal assistance or further information on the CPI data, as well as other Bureau data, contact the New England Information Office at 617-565-2327 from 8:30 a.m. to 12:00 p.m. and 1:30 p.m. to 4:00 p.m. ET. Information on the Consumer Price Index and other surveys and programs is available on our Web site at www.bls.gov/ro1/.
Technical Note
Average prices for electricity, utility (piped) gas, and gasoline are published monthly for the U.S. city average, the 4 regions, the 3 population size classes, 10 region/size-class cross-classifications, and the 14 largest local index areas. For electricity, average prices per kilowatt-hour (kWh) and per 500 kWh are published. For utility (piped) gas, average prices per therm, per 40 therms, and per 100 therms are published. For gasoline, the average price per gallon is published. Average prices for commonly available grades of gasoline are published as well as the average price across all grades.
Price quotes for 40 therms and 100 therms of utility (piped) gas and for 500 kWh of electricity are collected in sample outlets for use in the average price programs only. Since they are for specified consumption amounts, they are not used in the CPI. All other price quotes used for average price estimation are regular CPI data.
With the exception of the 40 therms, 100 therms, and 500 kWh price quotes, all eligible prices are converted to a price per normalized quantity. These prices are then used to estimate a price for a defined fixed quantity.
| Year and Month | Utility (piped) gas per therm | Electricity per kilowatt hour | Gasoline, all types, per gallon | |||
|---|---|---|---|---|---|---|
| U.S. city average | Boston-Brockton-Nashua | U.S city average | Boston-Brockton-Nashua | U.S. city average | Boston-Brockton-Nashua | |
| 2011 | ||||||
August |
1.079 | 1.056 | 0.135 | 0.148 | 3.680 | 3.727 |
September |
1.063 | 1.057 | 0.135 | 0.148 | 3.664 | 3.652 |
October |
1.047 | 1.056 | 0.130 | 0.146 | 3.521 | 3.499 |
November |
1.044 | 1.339 | 0.128 | 0.150 | 3.475 | 3.445 |
December |
1.034 | 1.339 | 0.127 | 0.150 | 3.329 | 3.314 |
| 2012 | ||||||
January |
1.021 | 1.339 | 0.128 | 0.152 | 3.447 | 3.442 | February |
0.986 | 1.240 | 0.128 | 0.152 | 3.622 | 3.623 |
March |
0.978 | 1.240 | 0.127 | 0.153 | 3.918 | 3.773 | April |
0.951 | 1.242 | 0.127 | 0.153 | 3.976 | 3.917 |
May |
0.907 | 0.827 | 0.129 | 0.143 | 3.839 | 3.791 |
June |
0.927 | 0.863 | 0.135 | 0.149 | 3.602 | 3.528 |
July |
0.943 | 0.863 | 0.133 | 0.145 | 3.502 | 3.524 |
August |
0.960 | 0.863 | 0.133 | 0.145 | 3.759 | 3.734 |
Last Modified Date: September 26, 2012