
Foreign Trade
You are here: Census.gov › Business & Industry ›Foreign Trade › U.S. International Trade Data
U.S. International Trade Data
Latest U.S. International Trade in Goods and Services Report
|
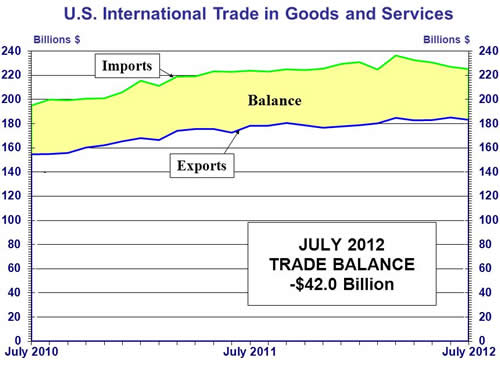
The Nation’s international trade balance in goods and services worsened to -$42.0 billion in July from -$41.9 billion in June (revised), as exports decreased more than imports. (September 11, 2012) |
July 2012 Trade Highlights
| |
Visualize Trade |
|
Graph of the Month
U.S. Exports of Manufactured Goods, July 2008 - July 2012 YTD
In anticipation of Manufacturing Day, July's graph shows the decline and recovery of U.S. exports of manufactured goods on a year-to-date basis. Total manufactured goods are comprised of twenty-one three-digit NAICS codes, such as the top three export valued codes displayed in the graph. Since July 2009, total U.S. exports of manufactured goods have steadily increased on a year-to-date basis.
You can obtain commodity data at the national and state level using USA Trade Online, our interactive online tool. If you have questions about USA Trade Online, call (301)763-2311 or email ftd.data.dissemination@census.gov.
Recent News
- August 2012 Preliminary Steel Imports | Release schedule
- U.S. Trade through Gulf Ports PDF | TXT | XLS
- Notice: Discontinuance of the U.S. Imports of Softwood Lumber from Canada Report
- 2011 Annual Trade Revisions
- Related Party Trade, 2011
- A Profile of U.S. Importing and Exporting Companies, 2009-2010 | Highlights
- Notice: Changes to FT-920: Merchandise Trade Highlights
- New Interactive Concordance: Exports | Imports
- New State Import Data Series
- Notice of change to Low Value Estimates
- Aircraft
Industry Trade Data Changes
July 2012
Trade Numbers
Deficit: $42.0 Billion
Exports: $183.3 Billion
Imports: $225.3 Billion
Next release: October 11, 2012
Complete Release Schedule
Export Training Videos
A collection of videos to enhance export trainingUpcoming Seminars and Workshops
The Fundamentals of Exporting Webinar Series
Go Global
Chicago, IL
Contact Us
Contact the Foreign Trade Data Dissemination staff: Email us! or use our feedback form!
Call us: (301)763-2311 or 1-800-549-0595 option 4
 Facebook
 Twitter
 Flickr
 YouTube