|
Download Data (XLS File) |
|
||||||||
|
||||||||
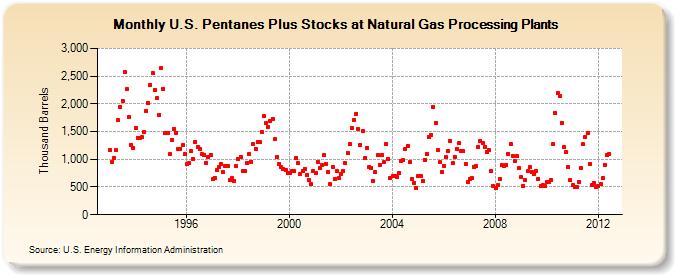
| U.S. Pentanes Plus Stocks at Natural Gas Processing Plants (Thousand Barrels) | ||||||||
| Year | Jan | Feb | Mar | Apr | May | Jun | Jul | Aug | Sep | Oct | Nov | Dec |
|---|---|---|---|---|---|---|---|---|---|---|---|---|
| 1993 | 1,163 | 958 | 1,026 | 1,160 | 1,701 | 1,940 | 2,051 | 2,572 | 2,264 | 1,757 | 1,265 | 1,212 |
| 1994 | 1,569 | 1,389 | 1,389 | 1,394 | 1,498 | 1,872 | 2,014 | 2,336 | 2,552 | 2,252 | 2,105 | 1,806 |
| 1995 | 2,653 | 2,274 | 1,478 | 1,475 | 1,088 | 1,344 | 1,552 | 1,479 | 1,182 | 1,191 | 1,251 | 1,090 |
| 1996 | 911 | 929 | 1,142 | 1,008 | 1,316 | 1,224 | 1,182 | 1,088 | 1,073 | 941 | 1,035 | 1,081 |
| 1997 | 637 | 670 | 804 | 861 | 921 | 770 | 872 | 878 | 624 | 655 | 614 | 880 |
| 1998 | 997 | 1,043 | 783 | 782 | 938 | 1,098 | 956 | 1,272 | 1,194 | 1,315 | 1,309 | 1,488 |
| 1999 | 1,779 | 1,649 | 1,584 | 1,694 | 1,732 | 1,358 | 1,036 | 922 | 864 | 830 | 814 | 757 |
| 2000 | 758 | 789 | 787 | 1,025 | 936 | 740 | 785 | 833 | 708 | 630 | 549 | 782 |
| 2001 | 759 | 955 | 835 | 899 | 1,079 | 916 | 769 | 546 | 864 | 636 | 785 | 663 |
| 2002 | 743 | 781 | 925 | 1,117 | 1,273 | 1,558 | 1,716 | 1,822 | 1,549 | 1,259 | 1,514 | 1,018 |
| 2003 | 1,209 | 864 | 843 | 615 | 762 | 1,069 | 904 | 1,086 | 949 | 1,282 | 1,002 | 663 |
| 2004 | 695 | 706 | 686 | 751 | 972 | 985 | 1,186 | 1,247 | 945 | 649 | 574 | 481 |
| 2005 | 701 | 690 | 608 | 995 | 1,104 | 1,408 | 1,440 | 1,943 | 1,660 | 1,166 | 943 | 776 |
| 2006 | 879 | 1,037 | 1,141 | 1,332 | 926 | 1,042 | 1,189 | 1,286 | 1,150 | 1,145 | 922 | 590 |
| 2007 | 644 | 659 | 867 | 871 | 1,222 | 1,334 | 1,290 | 1,228 | 1,126 | 1,161 | 787 | 522 |
| 2008 | 482 | 539 | 647 | 889 | 870 | 901 | 1,099 | 1,271 | 1,060 | 961 | 1,052 | 847 |
| 2009 | 672 | 524 | 621 | 780 | 854 | 779 | 727 | 796 | 650 | 515 | 527 | 513 |
| 2010 | 597 | 597 | 620 | 1,268 | 1,838 | 2,188 | 2,144 | 1,663 | 1,219 | 1,130 | 855 | 619 |
| 2011 | 534 | 499 | 499 | 592 | 846 | 1,268 | 1,409 | 1,472 | 922 | 528 | 570 | 501 |
| 2012 | 510 | 545 | 663 | 900 | 1,078 | 1,100 | ||||||
| - = No Data Reported; -- = Not Applicable; NA = Not Available; W = Withheld to avoid disclosure of individual company data. |
| Release Date: 8/30/2012 |
| Next Release Date: Last Week of September 2012 |