|
Download Data (XLS File) |
|
||||||||
|
||||||||
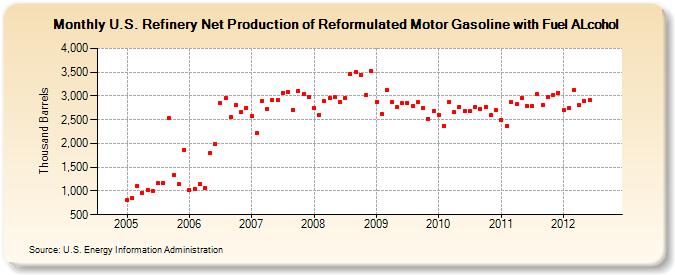
| U.S. Refinery Net Production of Reformulated Motor Gasoline with Fuel ALcohol (Thousand Barrels) | ||||||||
| Year | Jan | Feb | Mar | Apr | May | Jun | Jul | Aug | Sep | Oct | Nov | Dec |
|---|---|---|---|---|---|---|---|---|---|---|---|---|
| 2005 | 807 | 856 | 1,113 | 963 | 1,021 | 1,009 | 1,158 | 1,166 | 2,534 | 1,336 | 1,138 | 1,872 |
| 2006 | 1,023 | 1,042 | 1,140 | 1,070 | 1,803 | 1,991 | 2,847 | 2,956 | 2,563 | 2,817 | 2,661 | 2,752 |
| 2007 | 2,584 | 2,214 | 2,892 | 2,726 | 2,917 | 2,904 | 3,064 | 3,088 | 2,713 | 3,108 | 3,043 | 2,986 |
| 2008 | 2,751 | 2,605 | 2,892 | 2,952 | 2,967 | 2,875 | 2,955 | 3,459 | 3,504 | 3,447 | 3,015 | 3,524 |
| 2009 | 2,882 | 2,621 | 3,127 | 2,862 | 2,767 | 2,841 | 2,859 | 2,798 | 2,863 | 2,747 | 2,518 | 2,678 |
| 2010 | 2,600 | 2,370 | 2,875 | 2,654 | 2,775 | 2,682 | 2,673 | 2,766 | 2,731 | 2,770 | 2,593 | 2,697 |
| 2011 | 2,501 | 2,364 | 2,879 | 2,826 | 2,959 | 2,798 | 2,786 | 3,033 | 2,811 | 2,968 | 3,029 | 3,071 |
| 2012 | 2,700 | 2,742 | 3,132 | 2,800 | 2,900 | 2,918 | ||||||
| - = No Data Reported; -- = Not Applicable; NA = Not Available; W = Withheld to avoid disclosure of individual company data. |
| Release Date: 8/30/2012 |
| Next Release Date: Last Week of September 2012 |