|
Download Data (XLS File) |
|
||||||||
|
||||||||
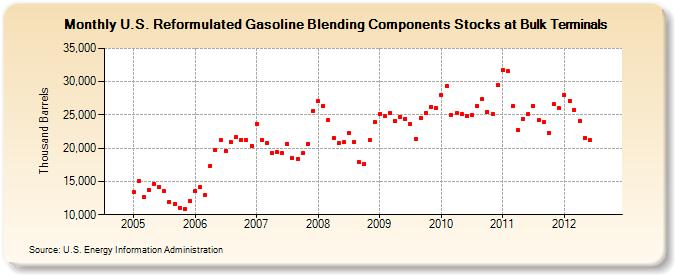
| U.S. Reformulated Gasoline Blending Components Stocks at Bulk Terminals (Thousand Barrels) | ||||||||
| Year | Jan | Feb | Mar | Apr | May | Jun | Jul | Aug | Sep | Oct | Nov | Dec |
|---|---|---|---|---|---|---|---|---|---|---|---|---|
| 2005 | 13,423 | 15,135 | 12,674 | 13,718 | 14,662 | 14,211 | 13,497 | 11,941 | 11,681 | 11,073 | 10,916 | 12,131 |
| 2006 | 13,615 | 14,154 | 13,020 | 17,381 | 19,797 | 21,217 | 19,601 | 20,916 | 21,691 | 21,298 | 21,186 | 20,340 |
| 2007 | 23,676 | 21,235 | 20,772 | 19,350 | 19,456 | 19,209 | 20,675 | 18,450 | 18,407 | 19,251 | 20,656 | 25,648 |
| 2008 | 27,052 | 26,407 | 24,236 | 21,556 | 20,728 | 20,872 | 22,356 | 20,975 | 17,907 | 17,669 | 21,229 | 23,928 |
| 2009 | 25,145 | 24,882 | 25,260 | 24,095 | 24,737 | 24,431 | 23,685 | 21,400 | 24,573 | 25,355 | 26,234 | 26,005 |
| 2010 | 27,958 | 29,327 | 25,032 | 25,275 | 25,096 | 24,771 | 25,030 | 26,325 | 27,363 | 25,506 | 25,136 | 29,461 |
| 2011 | 31,819 | 31,549 | 26,329 | 22,754 | 24,418 | 25,136 | 26,393 | 24,247 | 23,982 | 22,352 | 26,599 | 25,995 |
| 2012 | 27,998 | 27,104 | 25,780 | 24,127 | 21,590 | 21,220 | ||||||
| - = No Data Reported; -- = Not Applicable; NA = Not Available; W = Withheld to avoid disclosure of individual company data. |
| Release Date: 8/30/2012 |
| Next Release Date: Last Week of September 2012 |