|
Download Data (XLS File) |
|
||||||||
|
||||||||
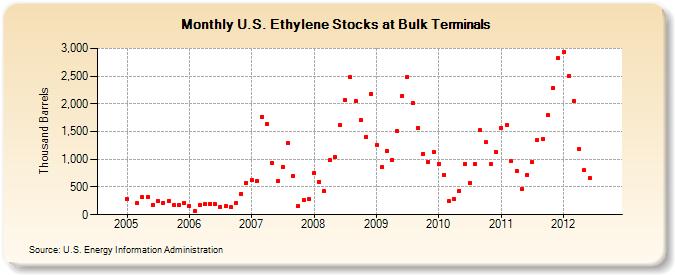
| U.S. Ethylene Stocks at Bulk Terminals (Thousand Barrels) | ||||||||
| Year | Jan | Feb | Mar | Apr | May | Jun | Jul | Aug | Sep | Oct | Nov | Dec |
|---|---|---|---|---|---|---|---|---|---|---|---|---|
| 2005 | 285 | 204 | 312 | 323 | 181 | 244 | 216 | 251 | 170 | 171 | 216 | |
| 2006 | 164 | 62 | 178 | 197 | 199 | 188 | 145 | 149 | 131 | 220 | 381 | 574 |
| 2007 | 626 | 608 | 1,771 | 1,637 | 936 | 606 | 868 | 1,285 | 705 | 156 | 258 | 279 |
| 2008 | 751 | 596 | 421 | 982 | 1,038 | 1,614 | 2,071 | 2,480 | 2,043 | 1,708 | 1,407 | 2,179 |
| 2009 | 1,260 | 855 | 1,156 | 987 | 1,515 | 2,147 | 2,481 | 2,007 | 1,569 | 1,104 | 947 | 1,135 |
| 2010 | 921 | 723 | 248 | 282 | 435 | 912 | 579 | 916 | 1,519 | 1,306 | 907 | 1,134 |
| 2011 | 1,573 | 1,619 | 966 | 793 | 464 | 722 | 946 | 1,356 | 1,367 | 1,790 | 2,288 | 2,822 |
| 2012 | 2,930 | 2,502 | 2,047 | 1,177 | 804 | 661 | ||||||
| - = No Data Reported; -- = Not Applicable; NA = Not Available; W = Withheld to avoid disclosure of individual company data. |
| Release Date: 8/30/2012 |
| Next Release Date: Last Week of September 2012 |