|
Download Data (XLS File) |
|
||||||||
|
||||||||
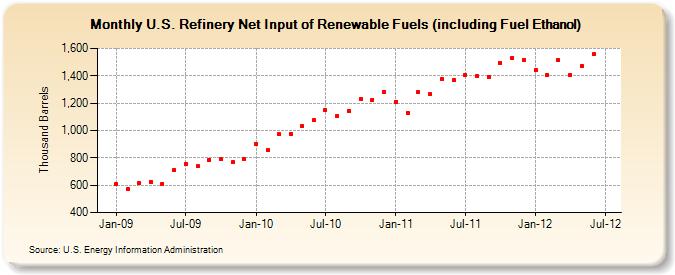
| U.S. Refinery Net Input of Renewable Fuels (including Fuel Ethanol) (Thousand Barrels) | ||||||||
| Year | Jan | Feb | Mar | Apr | May | Jun | Jul | Aug | Sep | Oct | Nov | Dec |
|---|---|---|---|---|---|---|---|---|---|---|---|---|
| 2009 | 608 | 572 | 614 | 625 | 612 | 710 | 756 | 737 | 785 | 788 | 767 | 791 |
| 2010 | 898 | 854 | 974 | 974 | 1,034 | 1,076 | 1,150 | 1,105 | 1,146 | 1,231 | 1,226 | 1,283 |
| 2011 | 1,211 | 1,131 | 1,278 | 1,268 | 1,375 | 1,370 | 1,409 | 1,396 | 1,393 | 1,496 | 1,532 | 1,513 |
| 2012 | 1,441 | 1,406 | 1,515 | 1,409 | 1,473 | 1,556 | ||||||
| - = No Data Reported; -- = Not Applicable; NA = Not Available; W = Withheld to avoid disclosure of individual company data. |
| Release Date: 8/30/2012 |
| Next Release Date: Last Week of September 2012 |