|
Download Data (XLS File) |
|
||||||||
|
||||||||
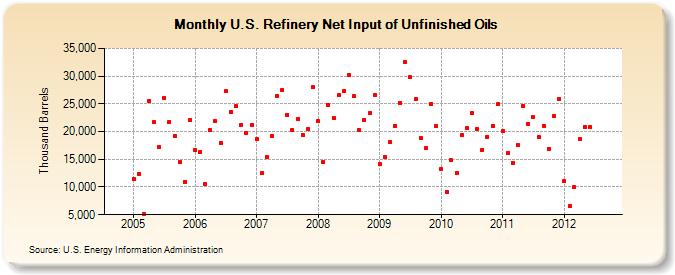
| U.S. Refinery Net Input of Unfinished Oils (Thousand Barrels) | ||||||||
| Year | Jan | Feb | Mar | Apr | May | Jun | Jul | Aug | Sep | Oct | Nov | Dec |
|---|---|---|---|---|---|---|---|---|---|---|---|---|
| 2005 | 11,422 | 12,374 | 5,040 | 25,553 | 21,708 | 17,139 | 26,027 | 21,727 | 19,241 | 14,423 | 10,922 | 22,155 |
| 2006 | 16,613 | 16,255 | 10,583 | 20,299 | 21,898 | 18,023 | 27,272 | 23,594 | 24,558 | 21,251 | 19,783 | 21,252 |
| 2007 | 18,596 | 12,535 | 15,336 | 19,208 | 26,453 | 27,570 | 23,066 | 20,266 | 22,331 | 19,355 | 20,412 | 27,987 |
| 2008 | 21,832 | 14,531 | 24,735 | 22,458 | 26,525 | 27,292 | 30,244 | 26,349 | 20,244 | 22,148 | 23,316 | 26,562 |
| 2009 | 14,061 | 15,427 | 18,136 | 21,035 | 25,174 | 32,479 | 29,785 | 25,797 | 18,857 | 16,981 | 24,938 | 20,966 |
| 2010 | 13,196 | 9,097 | 14,792 | 12,502 | 19,385 | 20,557 | 23,313 | 20,392 | 16,762 | 19,056 | 21,081 | 24,953 |
| 2011 | 20,013 | 16,111 | 14,366 | 17,552 | 24,666 | 21,363 | 22,539 | 18,930 | 21,012 | 16,900 | 22,768 | 25,898 |
| 2012 | 11,004 | 6,565 | 9,928 | 18,725 | 20,899 | 20,815 | ||||||
| - = No Data Reported; -- = Not Applicable; NA = Not Available; W = Withheld to avoid disclosure of individual company data. |
| Release Date: 8/30/2012 |
| Next Release Date: Last Week of September 2012 |
Referring Pages: