|
Download Data (XLS File) |
|
||||||||
|
||||||||
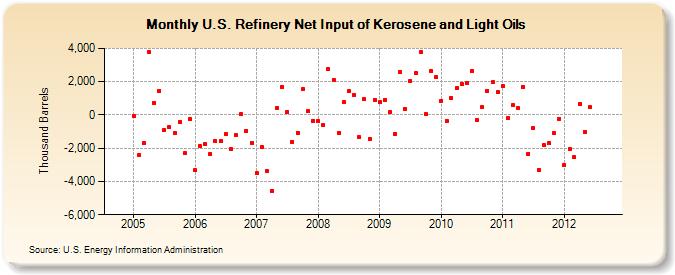
| U.S. Refinery Net Input of Kerosene and Light Oils (Thousand Barrels) | ||||||||
| Year | Jan | Feb | Mar | Apr | May | Jun | Jul | Aug | Sep | Oct | Nov | Dec |
|---|---|---|---|---|---|---|---|---|---|---|---|---|
| 2005 | -90 | -2,381 | -1,700 | 3,807 | 740 | 1,458 | -889 | -731 | -1,084 | -417 | -2,309 | -264 |
| 2006 | -3,312 | -1,893 | -1,762 | -2,347 | -1,583 | -1,574 | -1,161 | -2,065 | -1,235 | 40 | -943 | -1,662 |
| 2007 | -3,516 | -1,953 | -3,358 | -4,550 | 445 | 1,703 | 182 | -1,606 | -1,065 | 1,541 | 216 | -352 |
| 2008 | -369 | -628 | 2,740 | 2,120 | -1,071 | 755 | 1,436 | 1,200 | -1,333 | 935 | -1,439 | 904 |
| 2009 | 762 | 912 | 173 | -1,146 | 2,560 | 369 | 2,047 | 2,502 | 3,762 | 54 | 2,649 | 2,260 |
| 2010 | 852 | -364 | 1,018 | 1,627 | 1,867 | 1,913 | 2,620 | -310 | 460 | 1,456 | 1,953 | 1,388 |
| 2011 | 1,750 | -210 | 590 | 422 | 1,703 | -2,325 | -799 | -3,299 | -1,816 | -1,708 | -1,090 | -225 |
| 2012 | -3,013 | -2,025 | -2,549 | 680 | -1,019 | 463 | ||||||
| - = No Data Reported; -- = Not Applicable; NA = Not Available; W = Withheld to avoid disclosure of individual company data. |
| Release Date: 8/30/2012 |
| Next Release Date: Last Week of September 2012 |