|
Paul Denning, MD, MPH and Elizabeth DiNenno, PhD
METHODS
Background
According to UNAIDS, the United States (U.S.) has a concentrated HIV epidemic, primarily among men who have sex with men (MSM and injection drug users) (IDUs).1,2 While the HIV epidemic has not had a broad impact on the general U.S. population, it has greatly affected the economically disadvantaged in many urban areas. We sought to characterize the HIV epidemic in impoverished urban areas of the U.S. and determine whether the epidemic in these areas meets the UNAIDS definition of a generalized epidemic.
UNAIDS Definitions
Concentrated HIV Epidemic: The HIV prevalence rate is <1% in the general population, but >5% in at least one high-risk subpopulation, such as MSM, IDUs, commercial sex workers (CSWs), or the clients of CSWs.
Generalized HIV Epidemic: The HIV prevalence rate is >1% in the general population.
National HIV Behavioral Surveillance System for Heterosexuals –Round 1 (NHBS-HET-1)
- Anonymous, cross-sectional interview of men and women 18−50 years old who had an opposite-gender sex partner in the past year.
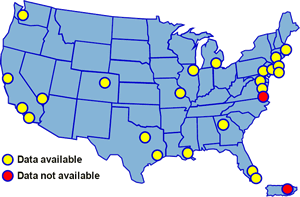
- Conducted in 25 cities throughout the U.S. from September 2006 to October 2007.
- Survey topics included demographic characteristics, sexual behavior, drug and alcohol use, HIV testing, sexually transmitted diseases, health conditions, and the use of prevention services.
- Anonymous HIV testing was offered to all participants.
- Participants were recruited using two methodologies: respondent-driven sampling (RDS) and venue-based sampling (VBS).
- Recruitment efforts targeted census tracts with high rates of poverty and HIV diagnosis called “High Risk Areas” (HRAs).
- For RDS, only HRA residents were allowed to recruit other participants.
- For VBS, recruitment venues were located in HRAs.
Analysis Sample
- Lived in a poverty area (census tract where ≥20% of residents had household incomes below the U.S. poverty level).
- Consented to HIV testing (98%) and had a valid HIV test result (99%).
- Resided in one of 23 cities with complete NHBS-HET-1 and census tract data.
- Northeastern Region: Boston, Nassau/Suffolk Counties, New Haven, New York City, Newark, and Philadelphia.
- Southern Region: Atlanta, Baltimore, Dallas, Fort Lauderdale, Houston, Miami, New Orleans, and Washington, DC.
- Midwestern Region: Chicago, Detroit, and St. Louis.
- Western Region: Denver, Las Vegas, Los Angeles, San Diego, San Francisco, and Seattle.
- Not a member of a high-risk sub-population (MSM, IDUs, CSWs, or CSW clients).
Statistical Analysis
- Associations with HIV prevalence were examined using chi-square, Fisher’s exact test, and multiple logistic regression.
- Because outcomes did not differ by recruitment method (RDS or VBS), data were combined in this analysis.
RESULTS
PLEASE NOTE: The data presented in this poster have been updated from the data presented in the published abstract.
Of 18,430 NHBS-HET-1 participants, 9,078 (49%) met our analysis criteria and lived in urban poverty areas; 188 (2.1%) of whom had a positive HIV test result. This HIV prevalence rate is more than 20 times greater than the rate among all heterosexuals in the U.S. (0.1%).2,3
HIV Prevalence, by Demographic Characteristics

Demographic characteristics significantly associated with HIV prevalence were age, education, annual household income, poverty level, employment, homeless status, and region. Multivariate modeling identified the same predictors of HIV prevalence (data not shown).
HIV Prevalence Rate, by Country

Data Sources: NHBS-HET-1 2006−2007 and UNAIDS HIV Estimates 2007.1
The 2.1% HIV prevalence rate found in urban poverty areas in the U.S. exceeded the 1% cut-off that defines a generalized HIV epidemic and is similar to the rates found in several low-income countries that have generalized HIV epidemics.1
HIV Prevalence Rate, by Income
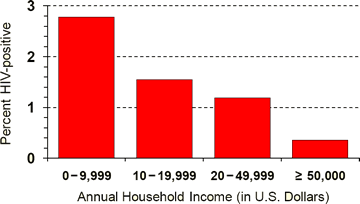
Data Source: NHBS-HET-1 2006−2007.
HIV prevalence rates in urban poverty areas were inversely related to annual household income–the lower the income, the greater the HIV prevalence rate.
This inverse relationship between HIV prevalence and socioeconomic status (SES) was observed for all SES metrics examined (education, annual household income, poverty level, employment, and homeless status).
HIV Prevalence Rate, by Race/Ethnicity

Data Sources: NHBS-HET-1 2006−2007 and U.S. HIV Prevalence Estimates 2006.2
HIV prevalence rates in urban poverty areas did not differ significantly by
race or ethnicity. This contrasts with the substantial racial and ethnic
differences found in rates for the overall U.S. population (which includes
high-risk sub-populations). For the overall U.S. population, the HIV prevalence
rate for blacks (1.7%) is more than 8 times the rate for whites (0.2%), and the
rate for Hispanics (0.6%) is 3 times the rate for whites.2
Poverty may account for some of the racial and ethnic disparities found in
HIV prevalence rates for the overall U.S. population–46% of blacks and 40% of
Hispanics live in poverty areas compared to just 10% of whites.4
References
1UNAIDS. 2008 report on the global AIDS epidemic 2008.
2CDC.
HIV prevalence estimates—United States, 2006. MMWR 2008;57:1073-76.
3U.S. Census Bureau. Annual estimates of the resident population by sex and selected age groups for the United States: April 1, 2000 to July 1, 2008. NC-EST2008-022009.
4U.S. Census Bureau. Areas with concentrated poverty: 1999. Census 2000 Special Reports 2005.
DISCUSSION
Limitations
- Since NHBS-HET-1 is a convenience sample drawn from selected cities, the urban poverty area residents who participated in the survey may not be representative of all urban poverty area residents in the U.S.
- Nevertheless, our analysis sample included demographically diverse participants from a large number (23) of cities throughout the U.S.
- Our findings are not generalizable to non-urban poverty area residents.
- Because NHBS-HET-1 targeted census tracts with high rates of poverty and HIV diagnosis (HRAs), our results may overestimate the HIV prevalence rate in urban poverty areas.
- However, despite this potential bias, we found that HIV prevalence
rates did not differ significantly between participants who were residents of HRAs (2.1%) and those who were not (2.0%).
Conclusions
- The HIV prevalence rate among NHBS-HET-1 participants living in urban poverty areas was very high (2.1%) and exceeded the 1% cut-off that defines a generalized HIV epidemic.
- HIV prevalence rates in urban poverty areas were inversely related to socioeconomic status (SES)–the lower the SES, the greater the HIV prevalence rate.
- Unlike overall HIV prevalence rates in the U.S., HIV prevalence rates in urban poverty areas did not differ significantly by race or ethnicity.
Recommendations
- HIV prevention efforts should be expanded in urban poverty areas in the U.S.
- Community-level interventions, in particular, would be ideal for these foci of high HIV prevalence.
- Structural interventions to improve socioeconomic conditions in these areas may reduce HIV infection rates.
- Spatial analysis should be used to identify areas of low socioeconomic status for targeting HIV prevention activities for heterosexuals at increased risk of HIV infection.
- The impact of the HIV epidemic in non-urban poverty areas should be assessed, especially in the Southern Region of the U.S. where there are high levels of rural poverty.
Contact Information
Address:
1600 Clifton Road, MS E-46
Atlanta, GA 30333, USA
E-mail: pdenning@cdc.gov
The findings and conclusions in this poster are those of the authors and do not necessarily represent the official position of the CDC.
|
