|
Download Data (XLS File) |
|
||||||||
|
||||||||
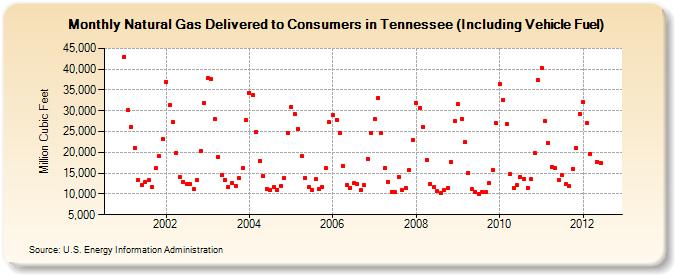
| Natural Gas Delivered to Consumers in Tennessee (Including Vehicle Fuel) (Million Cubic Feet) | ||||||||
| Year | Jan | Feb | Mar | Apr | May | Jun | Jul | Aug | Sep | Oct | Nov | Dec |
|---|---|---|---|---|---|---|---|---|---|---|---|---|
| 2001 | 43,045 | 30,197 | 26,202 | 21,053 | 13,399 | 12,059 | 12,967 | 13,230 | 11,569 | 16,135 | 19,011 | 23,239 |
| 2002 | 37,019 | 31,272 | 27,242 | 19,932 | 14,058 | 12,918 | 12,293 | 12,439 | 11,103 | 13,432 | 20,337 | 31,833 |
| 2003 | 37,778 | 37,692 | 27,915 | 18,989 | 14,580 | 13,392 | 11,615 | 12,627 | 12,016 | 13,775 | 16,202 | 27,807 |
| 2004 | 34,375 | 33,788 | 24,928 | 18,001 | 14,262 | 11,211 | 10,988 | 11,553 | 11,041 | 11,874 | 13,718 | 24,756 |
| 2005 | 30,997 | 29,214 | 25,561 | 19,122 | 13,849 | 11,579 | 11,055 | 13,522 | 11,117 | 11,668 | 16,197 | 27,185 |
| 2006 | 28,862 | 27,863 | 24,557 | 16,721 | 12,157 | 11,446 | 12,523 | 12,441 | 10,859 | 12,178 | 18,468 | 24,772 |
| 2007 | 27,984 | 33,128 | 24,595 | 16,228 | 12,933 | 10,542 | 10,388 | 14,044 | 10,952 | 11,488 | 15,733 | 22,992 |
| 2008 | 31,833 | 30,713 | 26,169 | 18,227 | 12,431 | 11,619 | 10,621 | 10,138 | 11,040 | 11,395 | 17,768 | 27,568 |
| 2009 | 31,563 | 28,104 | 22,409 | 15,148 | 11,118 | 10,503 | 9,922 | 10,496 | 10,455 | 12,553 | 15,752 | 26,950 |
| 2010 | 36,321 | 32,613 | 26,757 | 14,692 | 11,445 | 12,031 | 14,118 | 13,614 | 11,527 | 13,576 | 19,841 | 37,286 |
| 2011 | 40,377 | 27,448 | 22,336 | 16,458 | 16,212 | 13,414 | 14,472 | 12,404 | 11,789 | 16,054 | 21,072 | 29,225 |
| 2012 | 32,074 | 27,169 | 19,700 | NA | 17,728 | 17,354 | ||||||
| - = No Data Reported; -- = Not Applicable; NA = Not Available; W = Withheld to avoid disclosure of individual company data. |
| Release Date: 8/31/2012 |
| Next Release Date: 9/28/2012 |