|
Download Data (XLS File) |
|
||||||||
|
||||||||
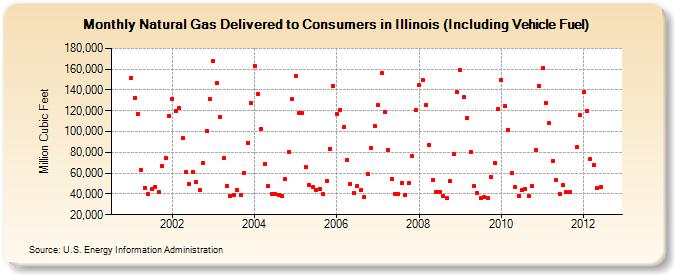
| Natural Gas Delivered to Consumers in Illinois (Including Vehicle Fuel) (Million Cubic Feet) | ||||||||
| Year | Jan | Feb | Mar | Apr | May | Jun | Jul | Aug | Sep | Oct | Nov | Dec |
|---|---|---|---|---|---|---|---|---|---|---|---|---|
| 2001 | 151,699 | 132,638 | 117,186 | 62,934 | 46,113 | 39,615 | 44,463 | 46,777 | 41,870 | 67,167 | 74,519 | 115,418 |
| 2002 | 131,434 | 119,430 | 122,242 | 93,668 | 61,529 | 49,664 | 60,624 | 51,277 | 43,656 | 70,127 | 100,944 | 131,720 |
| 2003 | 167,855 | 147,181 | 114,072 | 74,457 | 47,169 | 38,291 | 39,012 | 43,781 | 39,310 | 59,953 | 89,354 | 127,165 |
| 2004 | 163,310 | 135,906 | 102,899 | 68,328 | 47,779 | 40,404 | 40,176 | 39,133 | 37,585 | 53,947 | 80,742 | 131,346 |
| 2005 | 153,861 | 118,319 | 117,462 | 65,549 | 48,798 | 46,244 | 44,217 | 44,371 | 39,592 | 52,800 | 83,616 | 143,580 |
| 2006 | 116,915 | 121,058 | 104,406 | 73,083 | 49,546 | 41,255 | 47,256 | 43,727 | 36,875 | 59,300 | 83,859 | 105,529 |
| 2007 | 125,762 | 156,021 | 118,955 | 82,569 | 54,760 | 40,126 | 39,665 | 50,126 | 38,843 | 50,053 | 76,194 | 120,782 |
| 2008 | 144,934 | 149,486 | 125,866 | 87,177 | 53,552 | 41,567 | 42,200 | 37,929 | 35,830 | 52,062 | 78,310 | 137,991 |
| 2009 | 159,394 | 132,967 | 112,576 | 80,429 | 47,369 | 40,772 | 35,663 | 37,150 | 36,445 | 56,477 | 70,083 | 121,766 |
| 2010 | 149,768 | 124,146 | 101,678 | 59,804 | 46,337 | 38,139 | 43,750 | 44,854 | 37,891 | 47,528 | 82,320 | 143,843 |
| 2011 | 161,063 | 127,619 | 107,863 | 71,770 | 53,521 | 39,994 | 48,198 | 41,734 | 41,655 | NA | 84,741 | 115,497 |
| 2012 | 137,927 | 119,787 | 73,752 | 67,407 | 45,471 | 46,605 | ||||||
| - = No Data Reported; -- = Not Applicable; NA = Not Available; W = Withheld to avoid disclosure of individual company data. |
| Release Date: 8/31/2012 |
| Next Release Date: 9/28/2012 |