|
Download Data (XLS File) |
|
||||||||
|
||||||||
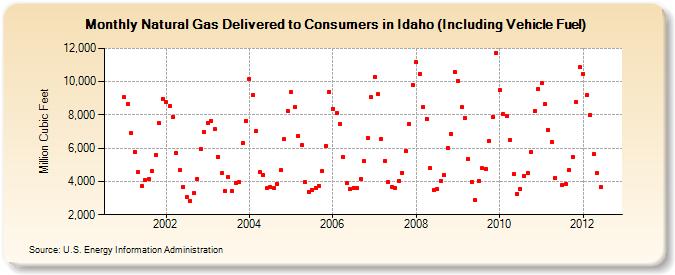
| Natural Gas Delivered to Consumers in Idaho (Including Vehicle Fuel) (Million Cubic Feet) | ||||||||
| Year | Jan | Feb | Mar | Apr | May | Jun | Jul | Aug | Sep | Oct | Nov | Dec |
|---|---|---|---|---|---|---|---|---|---|---|---|---|
| 2001 | 9,061 | 8,656 | 6,890 | 5,799 | 4,539 | 3,728 | 4,106 | 4,145 | 4,609 | 5,611 | 7,528 | 8,984 |
| 2002 | 8,747 | 8,547 | 7,861 | 5,699 | 4,667 | 3,654 | 3,038 | 2,812 | 3,303 | 4,162 | 5,950 | 7,000 |
| 2003 | 7,519 | 7,632 | 7,150 | 5,498 | 4,487 | 3,443 | 4,268 | 3,399 | 3,902 | 3,977 | 6,312 | 7,657 |
| 2004 | 10,168 | 9,168 | 7,032 | 4,556 | 4,391 | 3,602 | 3,672 | 3,601 | 3,844 | 4,668 | 6,536 | 8,238 |
| 2005 | 9,355 | 8,465 | 6,757 | 6,168 | 3,946 | 3,381 | 3,511 | 3,614 | 3,733 | 4,635 | 6,142 | 9,403 |
| 2006 | 8,375 | 8,140 | 7,439 | 5,455 | 3,877 | 3,562 | 3,628 | 3,580 | 4,158 | 5,229 | 6,622 | 9,056 |
| 2007 | 10,272 | 9,241 | 6,574 | 5,246 | 3,970 | 3,688 | 3,636 | 4,040 | 4,529 | 5,843 | 7,457 | 9,819 |
| 2008 | 11,163 | 10,467 | 8,471 | 7,774 | 4,801 | 3,497 | 3,518 | 4,056 | 4,375 | 6,014 | 6,853 | 10,599 |
| 2009 | 10,045 | 8,452 | 7,819 | 5,349 | 3,985 | 2,857 | 4,022 | 4,781 | 4,752 | 6,420 | 7,878 | 11,742 |
| 2010 | 9,471 | 8,055 | 7,929 | 6,521 | 4,435 | 3,252 | 3,564 | 4,355 | 4,520 | 5,748 | 8,257 | 9,545 |
| 2011 | 9,930 | 8,643 | 7,117 | 6,384 | 4,228 | NA | 3,794 | 3,860 | 4,684 | 5,492 | 8,805 | 10,862 |
| 2012 | 10,466 | 9,175 | 7,997 | 5,647 | 4,481 | 3,642 | ||||||
| - = No Data Reported; -- = Not Applicable; NA = Not Available; W = Withheld to avoid disclosure of individual company data. |
| Release Date: 8/31/2012 |
| Next Release Date: 9/28/2012 |