|
Download Data (XLS File) |
|
||||||||
|
||||||||
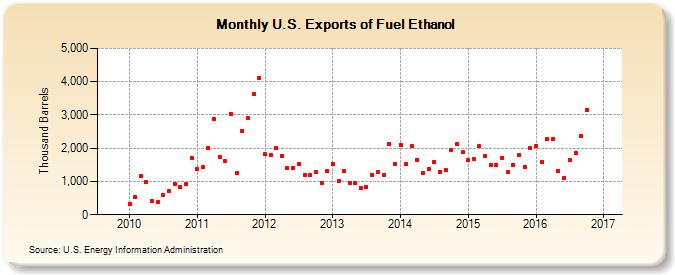
| U.S. Exports of Fuel Ethanol (Thousand Barrels) | ||||||||
| Year | Jan | Feb | Mar | Apr | May | Jun | Jul | Aug | Sep | Oct | Nov | Dec |
|---|---|---|---|---|---|---|---|---|---|---|---|---|
| 2010 | 324 | 519 | 1,153 | 973 | 414 | 387 | 603 | 707 | 929 | 834 | 930 | 1,717 |
| 2011 | 1,364 | 1,425 | 2,003 | 2,865 | 1,743 | 1,604 | 3,036 | 1,246 | 2,525 | 2,895 | 3,634 | 4,117 |
| 2012 | 1,819 | 1,785 | 1,992 | 1,775 | 1,397 | 1,410 | 1,519 | 1,206 | 1,191 | 1,284 | 965 | 1,313 |
| 2013 | 1,518 | 1,017 | 1,312 | 967 | 952 | 796 | 830 | 1,182 | 1,299 | 1,206 | 2,134 | 1,525 |
| 2014 | 2,091 | 1,517 | 2,059 | 1,659 | 1,265 | 1,378 | 1,599 | 1,292 | 1,353 | 1,949 | 2,114 | 1,872 |
| 2015 | 1,640 | 1,662 | 2,057 | 1,761 | 1,497 | 1,499 | 1,716 | 1,272 | 1,492 | 1,792 | 1,427 | 1,995 |
| 2016 | 2,076 | 1,598 | 2,270 | 2,276 | 1,328 | 1,108 | 1,652 | 1,856 | 2,373 | 3,135 | ||
| - = No Data Reported; -- = Not Applicable; NA = Not Available; W = Withheld to avoid disclosure of individual company data. |
| Release Date: 12/30/2016 |
| Next Release Date: 1/31/2017 |