June 15, 2001 (The Editor’s Desk is updated each business day.)
Producer prices edge up in May
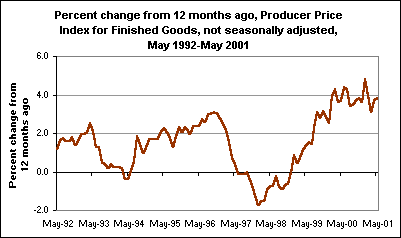
The Producer Price Index for Finished Goods rose 0.1 percent in May, seasonally adjusted. This increase followed a 0.3-percent gain in April and a 0.1-percent decline in March.
[Chart data—TXT]
Prices for finished goods other than foods and energy increased 0.2 percent for the second consecutive month. The May increase in the finished goods index was led by a 5.6-percent jump in cigarette prices. (Excluding cigarettes, the index for overall finished goods and the index for finished goods other than foods and energy both would have decreased 0.1 percent in May.)
Higher finished energy goods prices also contributed to May's increase, although to a lesser extent. By contrast, the index for finished consumer foods fell 0.4 percent, and capital equipment prices declined 0.1 percent in May.
From May 2000 to May 2001, prices for finished goods gained 3.8 percent. Over the same period, the index for finished energy goods increased 14.5 percent, prices for finished goods other than foods and energy advanced 1.6 percent, and the finished consumer foods index rose 2.6 percent.
These data are a product of the BLS Producer
Price Index program. Find out more in the "Producer
Price Indexes, May 2001", news release USDL 01-174. All producer
price indexes are routinely subject to revision once, 4 months after
original publication, to reflect the availability of late reports and
corrections by respondents.
Of interest
Spotlight on Statistics: National Hispanic Heritage Month
In this Spotlight, we take a look at the Hispanic labor force—including labor force participation, employment and unemployment, educational attainment, geographic location, country of birth, earnings, consumer expenditures, time use, workplace injuries, and employment projections.
.
Read more »