|
Download Data (XLS File) |
|
||||||||
|
||||||||
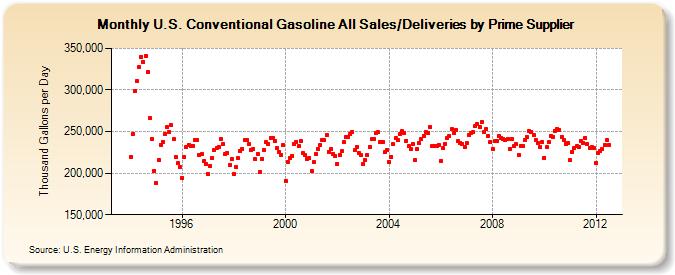
| U.S. Conventional Gasoline All Sales/Deliveries by Prime Supplier (Thousand Gallons per Day) | ||||||||
| Year | Jan | Feb | Mar | Apr | May | Jun | Jul | Aug | Sep | Oct | Nov | Dec |
|---|---|---|---|---|---|---|---|---|---|---|---|---|
| 1993 | NA | NA | NA | |||||||||
| 1994 | 219,965.3 | 246,498.9 | 298,753.5 | 310,391.0 | 327,657.5 | 339,729.7 | 333,724.2 | 340,985.4 | 321,815.0 | 266,027.6 | 241,147.3 | 202,891.9 |
| 1995 | 187,914.2 | 215,768.6 | 234,348.9 | 237,893.5 | 246,817.8 | 255,372.8 | 249,327.9 | 257,293.2 | 240,725.5 | 219,118.5 | 211,624.9 | 207,309.5 |
| 1996 | 194,452.7 | 219,625.6 | 231,561.0 | 234,283.2 | 232,813.4 | 232,966.9 | 239,887.6 | 239,502.2 | 222,136.3 | 222,656.4 | 214,351.2 | 210,972.9 |
| 1997 | 199,072.3 | 208,322.6 | 218,322.7 | 228,356.7 | 230,261.9 | 232,001.4 | 241,535.6 | 235,309.8 | 222,537.7 | 224,406.5 | 209,845.3 | 216,608.2 |
| 1998 | 198,757.4 | 207,270.7 | 217,763.4 | 226,468.6 | 229,411.0 | 239,550.8 | 240,432.4 | 234,732.6 | 228,311.2 | 229,162.2 | 216,901.0 | 223,340.9 |
| 1999 | 201,298.3 | 217,537.6 | 228,281.3 | 237,263.3 | 234,837.1 | 242,673.8 | 242,657.8 | 238,629.7 | 230,366.9 | 225,655.5 | 221,516.8 | 233,332.0 |
| 2000 | 190,864.7 | 213,811.4 | 218,402.6 | 220,917.9 | 234,922.4 | 237,780.6 | 232,551.1 | 238,850.0 | 224,481.0 | 221,373.5 | 217,120.7 | 217,965.4 |
| 2001 | 202,795.2 | 213,218.0 | 222,460.4 | 229,262.6 | 233,735.9 | 240,267.4 | 239,514.3 | 246,000.8 | 225,905.8 | 229,172.7 | 223,397.7 | 220,633.2 |
| 2002 | 211,316.3 | 222,288.5 | 226,188.0 | 236,949.4 | 243,494.1 | 243,689.5 | 246,899.1 | 249,766.0 | 227,498.4 | 231,175.9 | 224,135.7 | 221,343.8 |
| 2003 | 211,382.3 | 215,694.9 | 221,240.1 | 231,864.0 | 240,459.3 | 241,635.5 | 248,670.6 | 249,091.8 | 237,760.9 | 237,923.6 | 225,061.4 | 227,899.0 |
| 2004 | 213,857.1 | 219,753.9 | 234,844.9 | 242,356.4 | 239,494.8 | 246,602.3 | 250,072.9 | 248,654.4 | 239,095.9 | 232,248.3 | 228,859.9 | 235,537.6 |
| 2005 | 215,774.0 | 228,765.2 | 236,215.1 | 240,711.9 | 245,134.6 | 249,107.2 | 248,315.6 | 255,350.1 | 232,800.6 | 232,131.0 | 232,568.6 | 234,188.7 |
| 2006 | 215,137.0 | 229,841.9 | 235,061.0 | 242,543.7 | 244,375.7 | 252,533.8 | 248,017.6 | 252,413.4 | 238,311.9 | 236,559.3 | 234,941.1 | 231,757.2 |
| 2007 | 236,031.0 | 246,352.4 | 248,363.0 | 249,380.2 | 256,598.2 | 258,716.4 | 255,529.5 | 261,670.3 | 249,475.2 | 253,030.9 | 245,223.5 | 237,696.6 |
| 2008 | 229,100.1 | 238,388.1 | 238,283.0 | 244,175.2 | 242,559.6 | 241,065.1 | 240,088.8 | 241,270.8 | 229,309.2 | 241,068.5 | 232,070.3 | 234,606.2 |
| 2009 | 222,115.0 | 232,400.7 | 232,079.4 | 239,924.1 | 243,736.5 | 250,208.8 | 249,609.4 | 246,136.3 | 240,214.6 | 235,960.2 | 231,160.8 | 236,861.7 |
| 2010 | 218,633.1 | 231,220.6 | 237,292.1 | 244,718.2 | 243,808.4 | 251,144.5 | 253,064.8 | 251,387.2 | 243,958.6 | 239,332.3 | 235,553.8 | 235,987.4 |
| 2011 | 215,614.7 | 225,944.7 | 230,068.6 | 232,323.6 | 231,381.1 | 238,815.7 | 236,596.6 | 242,649.9 | 234,654.2 | 229,984.6 | 230,868.4 | 230,443.3 |
| 2012 | 212,061.0 | 224,680.1 | 226,300.5 | 228,572.3 | 233,910.6 | 239,331.0 | 234,194.5 | |||||
| - = No Data Reported; -- = Not Applicable; NA = Not Available; W = Withheld to avoid disclosure of individual company data. |
| Release Date: 9/24/2012 |
| Next Release Date: 10/22/2012 |