|
Download Data (XLS File) |
|
||||||||
|
||||||||
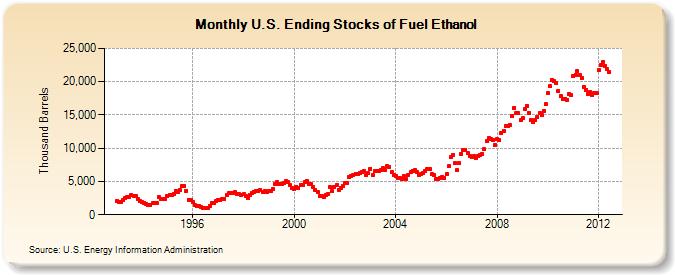
| U.S. Ending Stocks of Fuel Ethanol (Thousand Barrels) | ||||||||
| Year | Jan | Feb | Mar | Apr | May | Jun | Jul | Aug | Sep | Oct | Nov | Dec |
|---|---|---|---|---|---|---|---|---|---|---|---|---|
| 1993 | 2,059 | 1,946 | 1,929 | 2,152 | 2,441 | 2,627 | 2,706 | 2,941 | 2,805 | 2,810 | 2,335 | 2,114 |
| 1994 | 1,904 | 1,730 | 1,672 | 1,481 | 1,528 | 1,702 | 1,822 | 1,819 | 2,688 | 2,302 | 2,402 | 2,393 |
| 1995 | 2,747 | 3,025 | 3,017 | 3,125 | 3,618 | 3,387 | 3,734 | 4,324 | 4,312 | 3,626 | 2,282 | 2,186 |
| 1996 | 1,928 | 1,491 | 1,340 | 1,353 | 1,134 | 978 | 1,005 | 1,040 | 1,287 | 1,727 | 1,754 | 2,065 |
| 1997 | 2,259 | 2,215 | 2,341 | 2,379 | 2,964 | 3,195 | 3,240 | 3,217 | 3,432 | 3,150 | 3,080 | 2,925 |
| 1998 | 3,049 | 2,872 | 2,579 | 2,982 | 3,205 | 3,466 | 3,547 | 3,566 | 3,670 | 3,433 | 3,566 | 3,406 |
| 1999 | 3,576 | 3,612 | 3,859 | 4,553 | 4,938 | 4,572 | 4,593 | 4,740 | 5,009 | 4,862 | 4,423 | 4,024 |
| 2000 | 3,923 | 4,208 | 4,082 | 4,487 | 4,466 | 4,869 | 5,071 | 4,582 | 4,542 | 4,200 | 3,760 | 3,400 |
| 2001 | 2,811 | 2,771 | 2,691 | 2,936 | 3,172 | 4,152 | 3,503 | 4,226 | 4,438 | 3,783 | 4,038 | 4,298 |
| 2002 | 4,828 | 4,757 | 5,691 | 5,853 | 5,994 | 6,188 | 6,070 | 6,212 | 6,485 | 6,530 | 6,009 | 6,200 |
| 2003 | 6,933 | 5,943 | 6,549 | 6,528 | 6,507 | 6,753 | 6,975 | 6,744 | 7,256 | 7,201 | 6,472 | 5,978 |
| 2004 | 5,830 | 5,469 | 5,578 | 5,433 | 5,796 | 5,345 | 5,971 | 6,367 | 6,641 | 6,664 | 6,414 | 6,002 |
| 2005 | 6,142 | 6,261 | 6,605 | 6,861 | 6,810 | 6,064 | 5,926 | 5,398 | 5,317 | 5,591 | 5,723 | 5,563 |
| 2006 | 6,099 | 7,268 | 8,626 | 8,990 | 7,767 | 6,675 | 7,706 | 9,133 | 9,725 | 9,723 | 9,232 | 8,760 |
| 2007 | 8,656 | 8,765 | 8,539 | 8,807 | 8,966 | 9,171 | 9,866 | 11,011 | 11,555 | 11,449 | 11,218 | 10,535 |
| 2008 | 11,383 | 11,173 | 12,288 | 12,572 | 13,297 | 13,323 | 13,448 | 14,771 | 16,110 | 15,214 | 15,286 | 14,226 |
| 2009 | 14,514 | 15,834 | 16,411 | 15,322 | 14,173 | 13,974 | 14,223 | 14,671 | 15,283 | 14,933 | 15,578 | 16,594 |
| 2010 | 18,251 | 19,297 | 20,222 | 20,042 | 19,851 | 18,565 | 17,809 | 17,380 | 17,437 | 17,278 | 18,150 | 17,941 |
| 2011 | 20,826 | 21,016 | 21,593 | 21,065 | 20,609 | 19,217 | 18,788 | 18,123 | 18,465 | 18,038 | 18,308 | 18,238 |
| 2012 | 21,753 | 22,572 | 22,952 | 22,370 | 21,851 | 21,456 | ||||||
| - = No Data Reported; -- = Not Applicable; NA = Not Available; W = Withheld to avoid disclosure of individual company data. |
| Release Date: 8/30/2012 |
| Next Release Date: Last Week of September 2012 |