
History
You are here: Census.gov › History › Programs › Geography
Geography
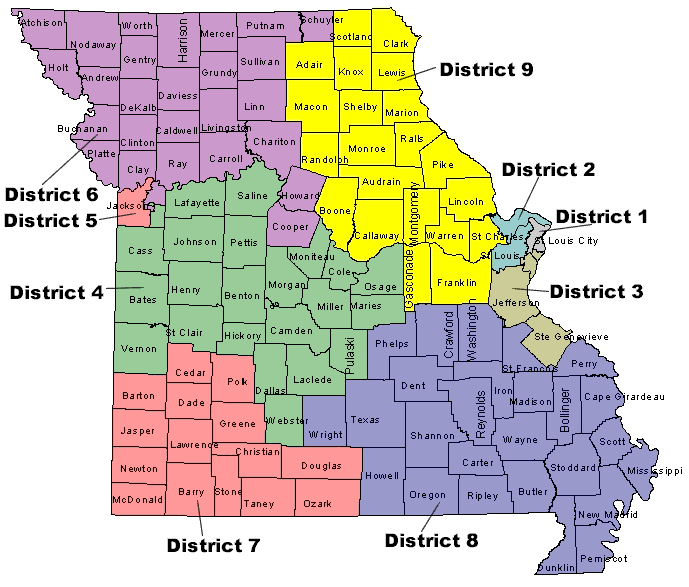
Missouri Congressional District Map
Maps are a unique way to study statistical information, making it very easy to compare data across geographic areas. They also provide a quick reference point that can be interpreted by almost anyone, regardless of educational level.
The U.S. Census Bureau produced its first map based on census results when it published James D.B. DeBow's 1854 map. Despite this early effort, maps were painstakingly difficult to produce. It was not until the end of the 19th and early 20th century that the Census Bureau regularly published maps, beginning with the statistical atlases produced by Francis A. Walker and Henry Gannett. After Gannett's departure from the Census Bureau, development of atlases for the 1930 and later censuses languished.
The computer revolution of the mid-20th century revitalized interest in development and publication of maps at the Census Bureau. Cartography has since become increasingly important to the operations and planning for the census, with census-takers using detailed maps to precisely locate housing units.
From J.D.B. DeBow's first regional map of the continental United States, to the development of the TIGER digital mapping system, to the new National Atlas, the Census Bureau has played an important role in the development of American cartography since the nineteenth century.
For more information:
- "Looking Back and Ahead: A History of Cartography at the Census Bureau and What the Future Holds," [PDF 1.09MD] Kaile Bower, U.S. Census Bureau, November 2010.
 Facebook
 Twitter
 Flickr
 YouTube