|
Download Data (XLS File) |
|
||||||||
|
||||||||
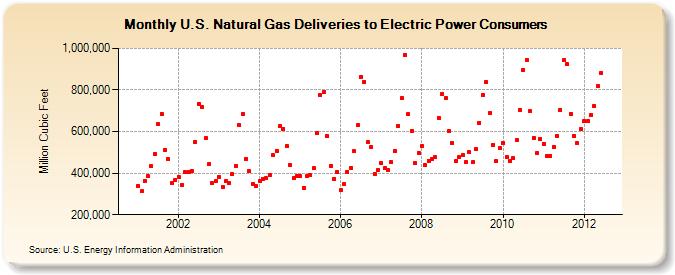
| U.S. Natural Gas Deliveries to Electric Power Consumers (Million Cubic Feet) | ||||||||
| Year | Jan | Feb | Mar | Apr | May | Jun | Jul | Aug | Sep | Oct | Nov | Dec |
|---|---|---|---|---|---|---|---|---|---|---|---|---|
| 2001 | 340,292 | 312,843 | 362,843 | 384,494 | 433,923 | 492,819 | 634,425 | 686,753 | 510,262 | 466,080 | 350,549 | 367,018 |
| 2002 | 381,434 | 344,243 | 406,516 | 404,384 | 410,108 | 550,941 | 733,887 | 717,592 | 568,699 | 442,357 | 351,612 | 360,123 |
| 2003 | 382,443 | 334,698 | 361,243 | 352,164 | 394,021 | 435,598 | 630,270 | 683,513 | 468,510 | 408,817 | 348,129 | 335,810 |
| 2004 | 361,401 | 373,466 | 375,203 | 389,328 | 485,114 | 508,140 | 626,401 | 612,571 | 529,440 | 439,841 | 376,169 | 386,690 |
| 2005 | 384,710 | 330,547 | 386,309 | 390,358 | 422,978 | 594,137 | 777,000 | 791,293 | 577,543 | 434,692 | 373,351 | 406,226 |
| 2006 | 318,364 | 346,138 | 406,970 | 426,027 | 504,409 | 629,660 | 863,531 | 840,197 | 548,321 | 527,532 | 396,586 | 414,365 |
| 2007 | 448,149 | 425,485 | 416,015 | 453,144 | 507,089 | 628,467 | 760,521 | 969,433 | 683,327 | 604,092 | 448,180 | 497,505 |
| 2008 | 531,460 | 438,868 | 460,763 | 469,607 | 475,467 | 665,436 | 782,039 | 762,946 | 602,565 | 545,244 | 457,591 | 476,394 |
| 2009 | 487,426 | 453,472 | 499,678 | 451,395 | 515,476 | 642,797 | 778,017 | 840,317 | 690,011 | 537,013 | 457,085 | 519,846 |
| 2010 | 545,811 | 479,615 | 456,864 | 471,481 | 559,665 | 705,665 | 897,182 | 943,002 | 696,723 | 570,363 | 496,539 | 564,274 |
| 2011 | 542,216 | 482,223 | 482,693 | 525,956 | 577,755 | 704,996 | 942,201 | 923,427 | 686,445 | 578,479 | 543,245 | 612,288 |
| 2012 | 651,316 | 649,172 | 680,047 | 724,075 | 818,775 | 883,745 | ||||||
| - = No Data Reported; -- = Not Applicable; NA = Not Available; W = Withheld to avoid disclosure of individual company data. |
| Release Date: 8/31/2012 |
| Next Release Date: 9/28/2012 |