|
Download Data (XLS File) |
|
||||||||
|
||||||||
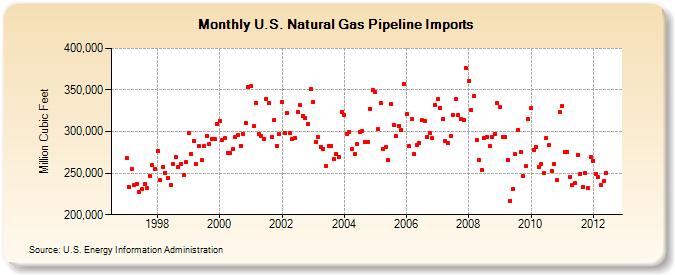
| U.S. Natural Gas Pipeline Imports (Million Cubic Feet) | ||||||||
| Year | Jan | Feb | Mar | Apr | May | Jun | Jul | Aug | Sep | Oct | Nov | Dec |
|---|---|---|---|---|---|---|---|---|---|---|---|---|
| 1997 | 268,310 | 232,878 | 254,455 | 235,621 | 236,725 | 227,059 | 230,567 | 237,149 | 232,119 | 246,707 | 259,656 | 255,149 |
| 1998 | 276,173 | 241,275 | 257,866 | 250,612 | 244,713 | 235,852 | 261,233 | 269,948 | 257,009 | 261,040 | 247,971 | 262,913 |
| 1999 | 297,724 | 273,524 | 288,520 | 261,258 | 282,063 | 265,218 | 282,301 | 294,745 | 285,441 | 291,345 | 290,977 | 308,959 |
| 2000 | 313,092 | 289,953 | 291,785 | 274,637 | 274,616 | 278,529 | 293,379 | 295,365 | 283,131 | 297,137 | 310,567 | 353,376 |
| 2001 | 354,873 | 306,190 | 334,858 | 296,560 | 294,734 | 290,824 | 339,472 | 334,220 | 293,037 | 314,389 | 283,195 | 296,461 |
| 2002 | 335,437 | 298,346 | 322,445 | 297,903 | 291,312 | 292,178 | 323,240 | 331,839 | 318,707 | 316,006 | 308,739 | 350,581 |
| 2003 | 336,055 | 287,797 | 293,362 | 281,973 | 279,344 | 258,964 | 282,729 | 282,616 | 266,841 | 273,482 | 269,978 | 324,089 |
| 2004 | 319,783 | 296,970 | 299,959 | 279,043 | 273,379 | 284,744 | 299,561 | 300,740 | 287,583 | 287,786 | 327,506 | 349,489 |
| 2005 | 347,187 | 302,957 | 333,765 | 278,581 | 281,369 | 265,332 | 332,952 | 308,175 | 294,082 | 306,729 | 301,411 | 357,234 |
| 2006 | 320,850 | 282,308 | 315,065 | 273,456 | 283,263 | 286,389 | 313,374 | 312,849 | 293,510 | 297,831 | 291,883 | 331,964 |
| 2007 | 339,699 | 328,773 | 314,931 | 288,095 | 285,893 | 294,883 | 320,231 | 339,062 | 319,730 | 315,286 | 314,068 | 376,118 |
| 2008 | 361,237 | 326,061 | 343,104 | 289,904 | 265,557 | 253,846 | 291,791 | 293,283 | 282,101 | 293,914 | 297,452 | 334,154 |
| 2009 | 329,817 | 293,657 | 293,580 | 265,807 | 217,001 | 231,217 | 272,463 | 302,255 | 274,840 | 246,067 | 258,186 | 314,512 |
| 2010 | 328,175 | 278,308 | 281,677 | 256,909 | 260,993 | 249,738 | 292,383 | 283,321 | 252,926 | 260,680 | 241,582 | 323,054 |
| 2011 | 330,691 | 275,967 | 275,723 | 245,122 | 235,427 | 237,860 | 272,312 | 249,024 | 232,895 | 250,153 | 232,202 | 269,568 |
| 2012 | 264,901 | 249,353 | 245,733 | 235,463 | 240,371 | 250,043 | ||||||
| - = No Data Reported; -- = Not Applicable; NA = Not Available; W = Withheld to avoid disclosure of individual company data. |
| Release Date: 8/31/2012 |
| Next Release Date: 9/28/2012 |