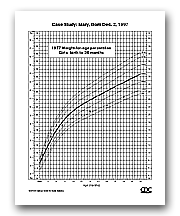
Case Study: Comparison of 1977 and 2000 Growth Charts
Mary, Born December 2, 1997
Race-Ethnicity: White Hispanic
Nutritional Profile: Exclusively breast fed, first 4 months; Solids gradually introduced after 4 months
| At Birth | 6 lb, 7 oz |
|---|---|
| At 1 Month | 9 lb, 8 oz |
| At 3 Months | 12 lb, 2 oz |
| At 4 Months | 14 lb, 5 oz |
| At 6 Months | 17 lb, 4 oz |
| At 8 Months | 17 lb, 4 oz |
| At 10 Months | 18 lb, 0 oz |
| At 12 Months | 19 lb, 0 oz |
| At 15 Months | 19 lb, 15 oz |
| At 18 Months | 20 lb, 14 oz |
| At 24 Months | 22 lb, 7 oz |
| At 30 Months | 24 lb, 10 oz |


Contact Us:
- National Center for Health Statistics
3311 Toledo Rd
Hyattsville, MD 20782 - 1 (800) 232-4636
- cdcinfo@cdc.gov
