


MapSearch
|

Biomass Maps
These maps illustrate the biomass resources available in the United States by county. Biomass feedstock data are analyzed both statistically and graphically using a geographic information system (GIS). The following feedstock categories are evaluated: crop residues, forest residues, primary and secondary mill residues, urban wood waste, and methane emissions from manure management, landfills, and domestic wastewater treatment.
Biomass Resources in the United States

|
Total Resources by County
Total Biomass per Square Kilometer
These maps estimate the biomass resources currently available in the United States by county. They include the following feedstock categories: crop residues (5 year average: 2003-2007) forest and primary mill residues (2007), secondary mill and urban wood waste (2002), methane emissions from landfills (2008), domestic wastewater treatment (2007), and animal manure (2002). For more information on the data development, please refer to http://www.nrel.gov/docs/fy06osti/39181.pdf. Although, the document contains the methodology for the development of an older assessment, the information is applicable to this assessment as well. The difference is only in the data's time period.

Crop residues
The following crops were included in this analysis: corn, wheat, soybeans, cotton, sorghum, barley, oats, rice, rye, canola, dry edible beans, dry edible peas, peanuts, potatoes, safflower, sunflower, sugarcane, and flaxseed. The quantities of crop residues that can be available in each county are estimated using total grain production, crop to residue ratio, moisture content, and taking into consideration the amount of residue left on the field for soil protection, grazing, and other agricultural activities. Source: USDA, National Agricultural Statistics Service; five-year average: 2003-2007.

Forest residues
This category includes logging residues and other removable material left after carrying out silviculture operations and site conversions. Logging residue comprises unused portions of trees, cut or killed by logging and left in the woods. Other removable materials are the unutilized volume of trees cut or killed during logging operations. Source: USDA, Forest Service's Timber Product Output database, 2007.

Primary mill residues
Primary mill residues include wood materials (coarse and fine) and bark generated at manufacturing plants (primary wood-using mills) when round wood products are processed into primary wood products, such as slabs, edgings, trimmings, sawdust, veneer clippings and cores, and pulp screenings. Source: USDA, Forest Service's Timber Product Output database, 2007.

Secondary mill residues
Secondary mill residues include wood scraps and sawdust from woodworking shops — furniture factories, wood container and pallet mills, and wholesale lumberyards. Data on the number of businesses by county was gathered from the U.S. Census Bureau, 2009 County Business Patterns.
Urban wood waste
 Urban wood waste includes wood residues from MSW (wood chips and pallets), utility tree trimming and/or private tree companies, and construction and demolition sites. Source: U.S. Census Bureau, 2010 Population data; BioCycle Journal: "State of Garbage in America", January 2008; County Business Patterns 2009.
Methane emissions from landfills
 The methane emissions are estimated for each landfill considering total waste in place, landfill size, and location (arid or non-arid climate), and then aggregated to county level. Note: this dataset doesn't include all landfills in the United States due to gaps in either precise geographic location or waste in place. Source: EPA, Landfill Methane Outreach Program (LMOP), April 2008.
Methane emissions from manure management
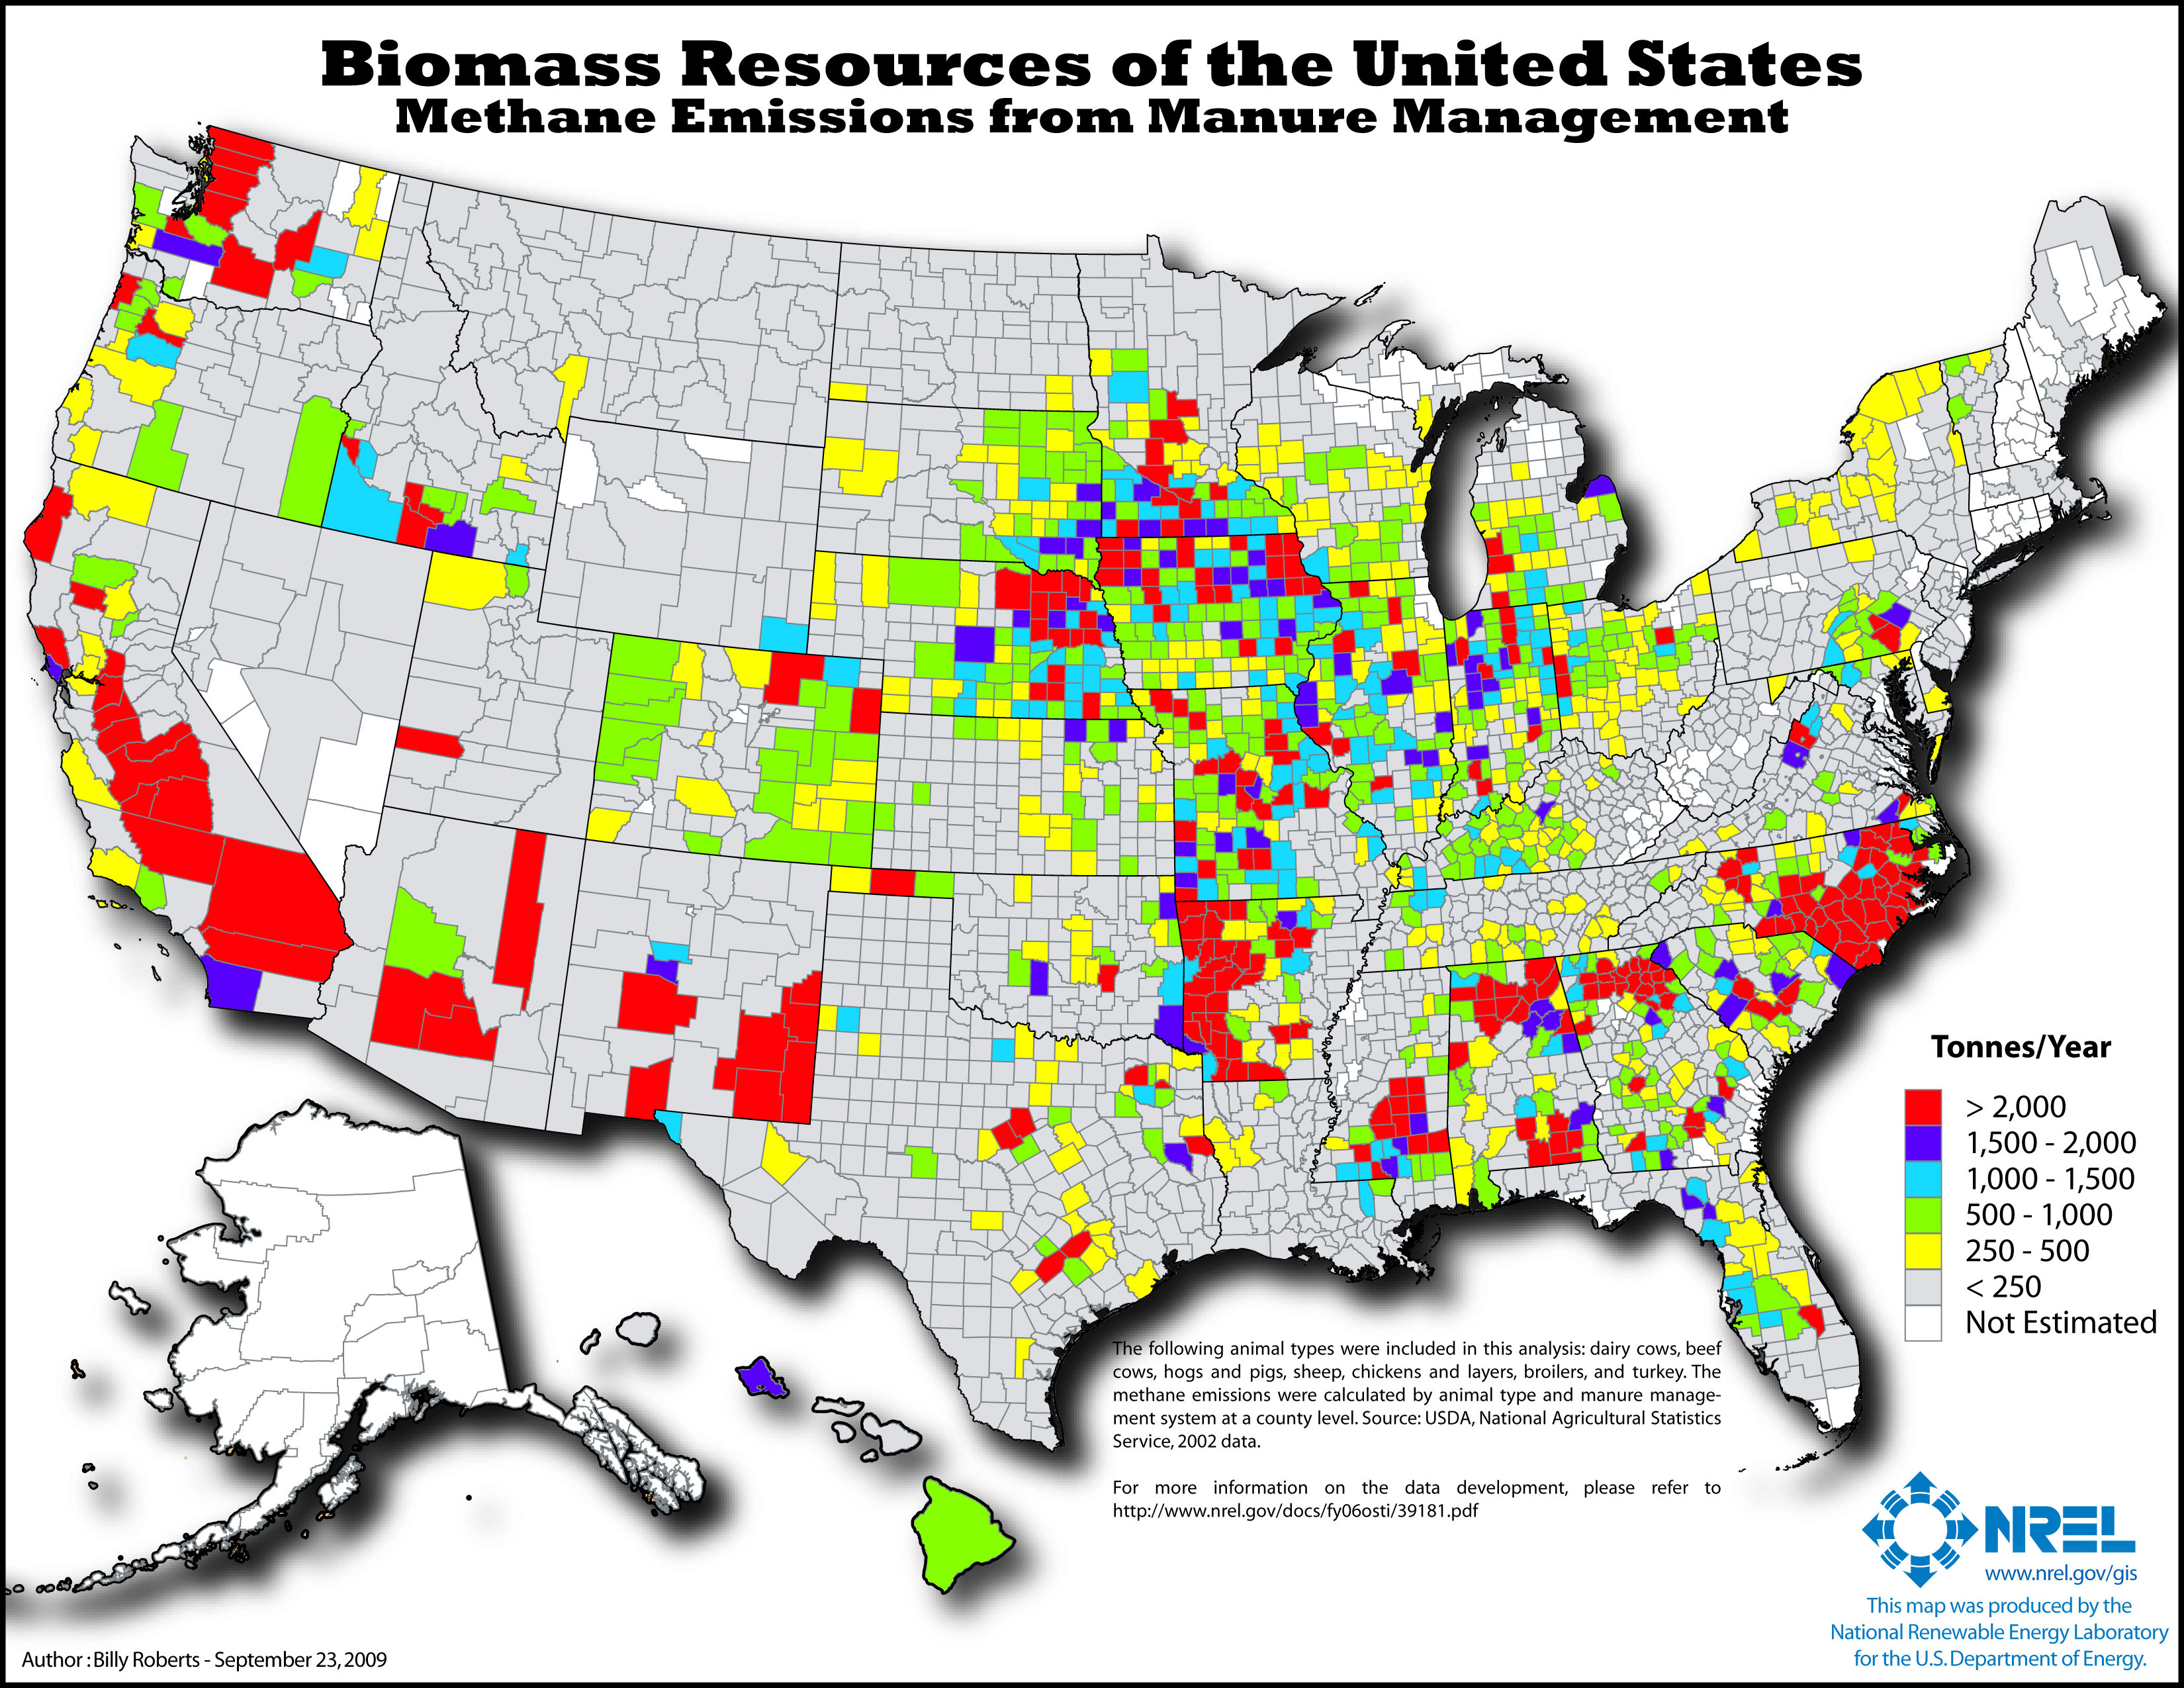 The following animal types were included in this analysis: dairy cows, beef cows, hogs and pigs, sheep, chickens and layers, broilers, and turkey. The methane emissions were calculated by animal type and manure management system at a county level. Source: USDA, National Agricultural Statistics Service, 2002 data.
Methane emissions from domestic wastewater treatment
 The methane emissions are estimated using the methodology from the EPA Inventory of U.S. Greenhouse Gas Emissions and Sinks: 1990-2003. Source: U.S. Census Bureau, 2007 County Population.
References
Anelia Milbrandt, "A Geographic Perspective on the Current Biomass Resource Availability in the United States," National Renewable Energy Laboratory, Golden CO, December 2005. Note: Although, the document contains the methodology for the development of an older assessment, the information is applicable to this assessment as well. The difference is only in the data's time period.
For more information on biomass resources, access the resource maps page on the Biomass Data and Resources site.
For Geographic Information System (GIS) biomass resource data, access the Data Resources page.
For interactive maps and tools for viewing maps and data, access the Data Visualization and Tools page.
If you have difficulty accessing these maps because of a disability, please contact the Webmaster.
